Homeownership, Household Makeup, and Latino and Vietnamese Population Growth in the New Orleans Metro
Published: Jun 14, 2011
New Census 2010 data suggests that the New Orleans metro may be bucking stereotypical notions about cities and suburbs. Suburban parishes, like Jefferson and St. Tammany, experienced the most significant growth among Hispanic and Vietnamese populations. And nearly every suburban parish has a higher rate of single–parent households than the national average. Meanwhile, homeownership declined in New Orleans’ suburbs, but grew within the city itself. The share of elderly living alone grew in most suburbs while shrinking in the city. These trends suggest that leaders may need to reconsider how to supply housing and other services to better accommodate new demographic realities around the region.
This week, the Census Bureau released yet another wave of once–every–ten–year data about New Orleans, the metro area, and the nation. (The New Orleans metro area is defined as the seven–parish Metropolitan Statistical Area encompassing New Orleans, and its suburban parishes, Jefferson, Plaquemines, St. Bernard, St. Charles, St. John the Baptist, and St. Tammany.) This new data provides an in–depth look at the growth in Latino and Asian subgroups in our region, changing homeownership trends and age distribution, as well as growing shares of one–person households, declining shares of households with children, and distribution of single–parent households and elderly living alone. This data can inform planning and policy making around housing, as well as policies and programs serving children, the elderly, and our growing Hispanic and Vietnamese populations.
Prior to 2000, national growth in the Latino population far exceeded local growth rates. But over the last 10 years, the metro experienced a significant influx of Latinos and may be an emerging gateway for Latino immigrants.
From 1980 through 2000, more than half of Latinos nationwide were Mexican. In contrast, in the New Orleans metro, Hispanics were more likely to be Cuban, Honduran, or of Spanish decent [1]. While the Hispanic population of the New Orleans metro grew only 15 percent from 1980 to 2000, the Latino population of the U.S. more than doubled, growing 141 percent in just 20 years. New Orleans’ relatively anemic growth suggests that the New Orleans metro was not an important U.S. gateway for Latino immigrants during these decades.
Instead, during this time frame, Hispanics’ settlement patterns shifted within the metro. Many Hispanics moved out of Orleans, Plaquemines, and St. Bernard and into St. Charles, St. John, St. Tammany, and particularly Jefferson Parish. For example, in 1980, New Orleans had 19,226 Hispanics and Jefferson had 21,772 Hispanics. Over the next 20 years, the Hispanic population in Jefferson increased 49 percent to 32,418 while the Hispanic population in New Orleans decreased 23 percent to 14,826.
But Katrina dramatically altered these trends. From 2000 to 2010 the Latino population in the New Orleans metro spiked 57 percent — a rate greater than the nation’s 43 percent growth — suggesting that New Orleans may be emerging as an important gateway for Latino immigrants.
New Orleans metro and the U.S.
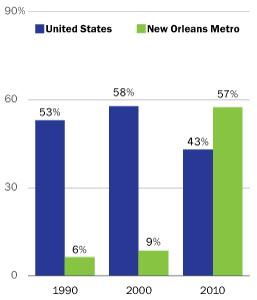
Source: The Data Center analysis of data from U.S. Census Bureau.
Mexicans accounts for only one–third of the growth in Hispanics in the metro area, while “other Hispanics” (many of whom may be Honduran) accounted for two–thirds of the growth. Thus, today only 23 percent of Hispanics in the New Orleans metro are Mexican, while nationally 63 percent of Hispanics are Mexican.
Like other emerging gateway metros such as Atlanta and Raleigh–Durham, Latinos in the New Orleans area are more likely to live in the suburbs than the city [2]. Indeed, from 2000 to 2010, the growth of Latino populations in St. Charles, St. John, St. Tammany, and Jefferson substantially picked up pace––growing between 66 and 132 percent. Meanwhile the loss of Latinos from Orleans and Plaquemines reversed course and Latino populations began to grow in these parishes. And St. Bernard’s population loss would have been greater had it not been for Latino residents who exhibited higher population recovery rates than white residents.
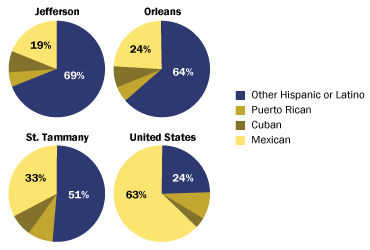
Today Jefferson is home to the largest number of Hispanics in the metro (53,702), 19 percent of whom are Mexican, 7 percent are Cuban, 5 percent are Puerto Rican, and 69 percent are “other.” Orleans has the second largest number of Hispanics (18,051), 24 percent of whom are Mexican, 7 percent are Cuban, 5 percent are Puerto Rican, and 64 percent are “other.” And St. Tammany now also has a sizable number of Hispanics (10,970), 33 percent of whom are Mexican, 7 percent are Cuban, 9 percent are Puerto Rican, and 51 percent are “other.”
Jefferson, Orleans, St. Tammany, and the U.S.
The New Orleans metro has served as a U.S. gateway for Vietnamese immigrants with large concentrations settling in Jefferson and Orleans parishes. Plaquemines and St. Bernard also have significant Vietnamese populations relative to their small population size.
Vietnamese are the most dominant Asian subgroup in Orleans, Jefferson, Plaquemines, and St. Bernard representing half or more of total Asians in each of these parishes. In St. Charles, St. John, and St. Tammany, however, the Asian population consists of a more balanced mix of several groups including Asian Indian, Chinese, and Filipinos.
Share of Asian population by nationality, 2010
New Orleans metro by parish
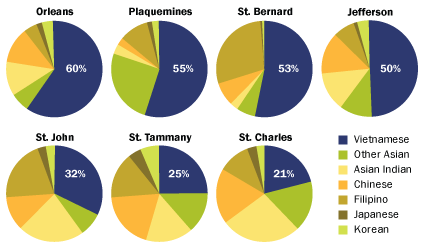
Source: The Data Center analysis of data from U.S. Census Bureau.
Indeed Jefferson, Orleans, Plaquemines, and St. Bernard all have larger shares of Vietnamese than the national average, and this has been the case in each of these parishes for several decades. In the 1970s, the New Orleans metro was an important U.S. gateway for Vietnamese immigrants when the Associated Catholic Charities of New Orleans helped many Vietnamese refugees settle in the area by finding them subsidized housing and jobs [3].
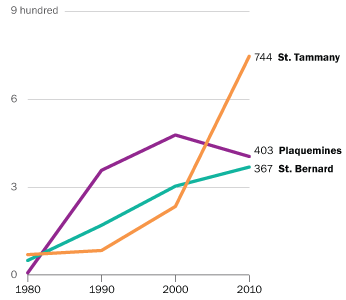
Over the last ten years, the Vietnamese populations have shifted toward Jefferson and St. Tammany and away from Orleans and Plaquemines. From 2000 to 2010, the number of Vietnamese in Jefferson Parish grew by 1,687 and in St. Tammany by 511. St. Bernard has also experienced an uptick in its Vietnamese population, despite its overall population loss. In Orleans, the number of Vietnamese decreased but at a lesser rate than the overall population loss rate for the parish. Today the number of Vietnamese in Jefferson is now one–third larger than in Orleans.
Vietnamese population
Jefferson, Orleans, Plaquemines, St. Bernard, and St. Tammany
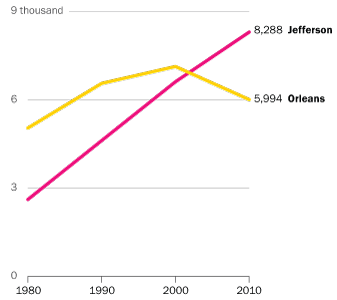
Source: The Data Center analysis of data from U.S. Census Bureau.
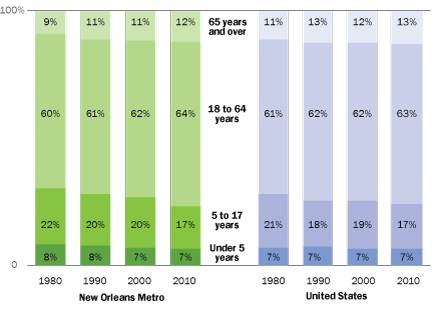
In 1980, residents of the New Orleans metro were slightly younger than the national average with greater shares of children and fewer elderly. Today, the metro’s age distribution is more closely aligned with the national age distribution.
In 1980, the New Orleans metro area population had slightly larger shares of children under five years old (8.3 percent) and school age children 5 to 17 years old (22.3 percent) than the national average (7.2 and 20.9 percent respectively). At that time elderly 65 years and over represented a smaller share of the metro population (9.1 percent) than the national average (11.3 percent), as did working adults 18 to 64 (60.4 percent compared to 60.6 percent nationally).
In the 1980s when the oil bust hit, the metro’s population shrank 1 percent while the nation’s population grew 10 percent. During that decade the metro’s share of children under 5 decreased slightly and the school age population shrank by 2 percentage points, while the working age population held relatively steady. The number of elderly grew substantially as many older residents likely chose to age in place. By 1990, elderly 65 and over represented 11 percent of the total metro area population.
In the 1990s, the metro population grew tepidly — 4 percent compared to national population growth of 13 percent. The metro experienced increases in elderly, working age adults, and school age children, but decreases in young children under 5 years old. By 2000, the share of the population that is children under 5 had fallen to less than 7 percent.
Since 2000, the share of children under 5 in the metro area has fallen only slightly while the share of school age children has contracted more than 3 percentage points. The share of the metro area that is working age has grown nearly 3 percentage points and the share that is 65 or older has increased nearly 1 percentage point. Today the metro area’s age distribution is older than in 1980 and is now more closely aligned with the national age distribution.
Age distribution
New Orleans metro and the U.S.
Source: The Data Center analysis of data from U.S. Census Bureau.
The past decade has brought notable changes to the age distribution of each parish. In 2000, the age distributions of Jefferson, Orleans, and St. Bernard were skewed slightly older with greater shares of working age adults and elderly while the age distributions of Plaquemines, St. Charles, St. John, and St. Tammany were skewed slightly younger with greater shares of children. In contrast, today it is Jefferson and St. Tammany that house a disproportionate share of the metro’s elderly 65 years and over. Orleans and St. Bernard are home to disproportionate shares of the metro’s working age population. Plaquemines, St. Bernard, St. Charles, and St. John house disproportionate shares of the metro’s young children under 5 years old, and these same four parishes plus St. Tammany house disproportionate shares of the metro’s school age children. Nonetheless, Jefferson and Orleans still house more than 60 percent of all children in the metro area.
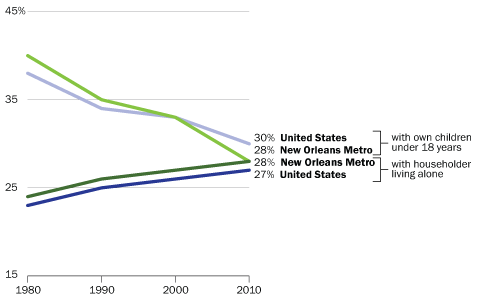
Across the metro area, as across the nation, the share of households with children is shrinking while the share of individuals living alone is growing, thus the average household size is falling.
As birth rates have declined in the U.S., average household size has declined from 2.75 in 1980 to 2.58 in 2010. Similarly, average household size across the metro area fell from 2.83 in 1980 to 2.52 in 2010 [4]. As such the composition of household types has changed over the years both nationally and locally. Nationwide the share of households with children has fallen from 38 percent in 1980 to 30 percent in 2010, while the share of single–person households has grown from 23 percent to 27 percent. Similarly across the metro area the share of households with children fell from 40 percent in 1980 to 28 percent in 2010, and the share of individuals living alone grew from 24 percent to 28 percent.
Share of households with own children under 18 years and householders living alone
New Orleans metro and the U.S.
Source: The Data Center analysis of data from U.S. Census Bureau.
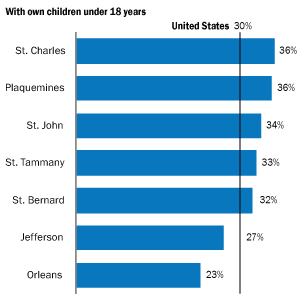
In each of the seven parishes that make up the metro area, the share of households with children is decreasing while the share of single–person households is increasing. That said, Orleans and Jefferson are somewhat more “urban” in their household makeup with a higher percent of individuals living alone (as compared with the national average) and a smaller percent of households with children. While Plaquemines, St. Bernard, St. Charles, St. John, and St. Tammany are more “suburban” in nature with larger shares of households with children and smaller shares of single–person households.
Share of households with own children under 18 years and householders living alone, 2010
New Orleans metro by parish and the U.S.
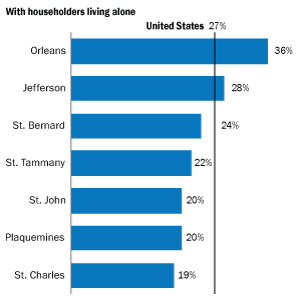
Source: The Data Center analysis of data from U.S. Census Bureau.
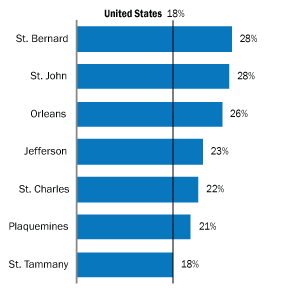
Single–parent households are a growing phenomenon nationally as well as locally, but the New Orleans metro has larger shares of single–parent households than the national average.
Nationally, the share of households that are single–parent headed increased from 13 percent in 1980 to 18 percent in 2010. Locally this share was 18 percent in 1980 and grew to 23 percent by 2010. St. Bernard and St. John have particularly high concentrations of single–parent headed households at 28 percent of all households. And in Orleans, the share of households that are single–parent headed has shrunk over the last ten years — now 26 percent down from 29 percent in 2000. But, in fact, all parishes in the metro area have a greater share of single–parent households than the national average — the only exception being St. Tammany, which is on par with the nation.
New Orleans metro by parish and the U.S.
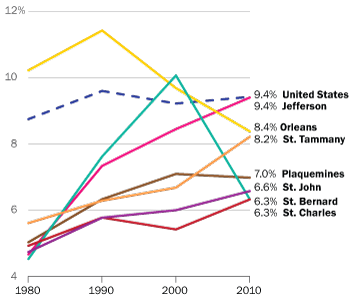
The share of households that are elderly living alone has decreased within the city of New Orleans but is growing in suburban parishes. The only exception is St. Bernard, where this share declined from 2000 to 2010.
Nationally, the share of households who are elderly living alone, has vacillated from 8.7 percent in 1980, to 9.6 percent in 1990, to 9.2 percent in 2000 to 9.4 percent in 2010. In Orleans Parish, this percent has declined since 1990 when it was 11.4 percent down to 8.4 percent in 2010. In the suburban parishes, however, the share of households that are elderly living alone has grown significantly (with the notable exception of St. Bernard). Jefferson has experienced the most significant growth from 4.7 percent of all households in 1980 to 9.4 percent in 2010.
Share of households that are elderly living alone
New Orleans metro by parish and the U.S.
Source: The Data Center analysis of data from U.S. Census Bureau.
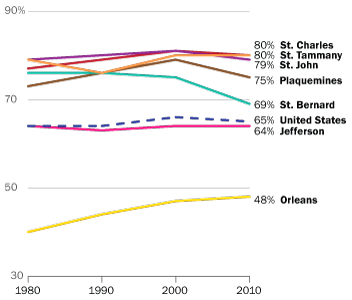
Prior to Katrina, New Orleans’ homeownership rate lagged the nation but most suburban parishes had homeownership rates exceeding the national average. While this is still true in 2010, homeownership is growing in New Orleans and declining in the suburban parishes.
From 1980 to 2000, the U.S. homeownership rate grew slightly from 64 percent to 66 percent. Over these two decades, the homeownership rate in the metro area jumped from 55 percent to 62 percent. Over the last ten years, the homeownership rate in the New Orleans metro expanded to 63 percent, driven primarily by an increase in homeownership in Orleans Parish. Today, the homeownership rate in New Orleans is 48 percent up from 47 percent in 2000. Homeownership rates in all six suburban parishes have fallen slightly, while the national homeownership rate also has fallen one percentage point since 2000.
Homeownership rate
New Orleans metro by parish and the U.S.
Source: The Data Center analysis of data from U.S. Census Bureau.
Limitations of the decennial census
Studies of the accuracy of the Census 2010 count will not be undertaken until more Census 2010 data has been released. However, studies of earlier decennial censuses provide guidance as to likely limitations of the Census 2010. A state–specific study of the Census 2000 undercount conducted by PricewaterhouseCoopers concluded that Louisiana’s population in 2000 was undercounted by 60,698 or 1.34 percent [5]. Studies of both the 1990 and 2000 decennial censuses concluded that American Indians, Asians, African Americans, Hispanics, and children were most likely to be undercounted [6]. And a study of the 2000 decennial census concluded that some people were double counted, including college students living away from home, and families counted at both their main and vacation homes. These people were more likely to be white and higher–income [7].
[1] The 2000 Census provided greater detail about the “other Hispanic” category. Of the 38,834 “other Hispanics” in the metro area in 2000, the largest subgroups were 8,111 Hondurans, 3,900 Spanish, and 16,033 “all other Hispanic or Latino.”
[2] Singer, A. (2004, February). The Rise of New Immigrant Gateways. Retrieved May 26, 2011, from Brookings: http://www.brookings.edu/urban/pubs/20040301_gateways.pdf
[3] Leong, K. J., Airriess, C. A., Li, W., Chen, A. C.–C., & Keith, V. M. (2007). Resilient History and the Rebuilding of a Community: The Vietnamese American Community in New Orleans East. Journal of American History, 94, 770–779.
[4] Plyer, A. (2011). Changes in Household Size and Group Quarters Populations Across the New Orleans Metro. The Data Center: https://www.datacenterresearch.org/reports_analysis/average-household-size-and-group-quarters/.
[5] PricewaterhouseCoopers. (2001, August 7). Census 2000 Undercount Could Cost States Billions. Retrieved May 11, 2011, from U.S. Census Monitoring Board Presidential Members: http://govinfo.library.unt.edu/cmb/cmbp/reports/080601.pricewaterhouse/state_la.asp.htm
[6] Edmonston, B. (2002, May). The Undercount in the 2000 Census. Retrieved May 11, 2011, from The Annie E. Casey Foundation: http://www.aecf.org/upload/publicationfiles/undercount%20in%202000%20census.pdf
[7] Eriksen, E. (2001). An Evaluation of the 2000 Census and Census Bureau Efforts to Measure the Gross and Net Rates of Undercount. North Dakota Law Review , 77, 753.
Suggested Citation: The Data Center analysis of data from U.S. Census Bureau.