Population Loss and Vacant Housing in New Orleans Neighborhoods
Published: Feb 05, 2011
Since 2000, the city’s population shrank by 140,845 persons, resulting in thousands of abandoned homes, commercial and institutional buildings. But New Orleans’ population loss began before Katrina, and the vast majority of New Orleans’ neighborhoods lost population this decade, regardless of whether or not they flooded in 2005. In 2010, the Census counted 47,738 vacant homes across the city.
At 343,829, the 2010 population of New Orleans is roughly the same as it was 100 years ago when the 1910 Census counted 339,075 persons living in the city. But the residential patterns of 2010 are wider spread across the city than they were in 1910, having expanded significantly in the later half of the twentieth century.
The population of New Orleans peaked in 1960 at 627,525 people. Since then, the city has lost 283,696 residents—leaving thousands of excess homes, commercial and institutional buildings abandoned. According to Census Bureau estimates, the city lost nearly 30,000 residents in only five years—those immediately preceding Katrina—suggesting that the net loss after the storm was about 110,000 people.
Total Population
New Orleans
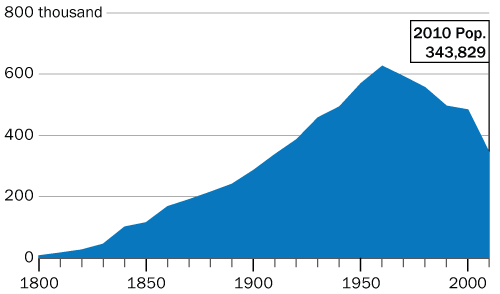
Sources: The Data Center compilation of data from “Bienville’s Dilemma” by Richard Campanella and U.S. Census Bureau.
This brief examines the changes in population by neighborhood from 2000 to 2010, which are largely but not entirely, a result of the 2005 levee failures, as well as the number of vacant housing units in each neighborhood in 2010.
The vast majority of New Orleans’ neighborhoods lost population over the last ten years, regardless of whether or not they flooded in 2005.
Most of New Orleans’ 72 neighborhoods now have fewer residents than ten years ago. Fully 65 neighborhoods lost population from 2000 to 2010, including 17 neighborhoods that largely did not flood, nor are they under major redevelopment [1].
For example, the Irish Channel lost 897 residents or 21 percent of its population, and the French Quarter lost 363 residents or 9 percent of its population since 2000, but these losses are likely not due to flood–induced displacement but instead to population loss that may have begun before the levees broke.
In the map below, the 15 neighborhoods that are depicted in the lightest shade of blue lost up to 14 percent of their population between 2000 and 2010. Fully 13 of these neighborhoods including three on the west bank and many along the “sliver by the river,” such as the Garden District, Touro and Black Pearl, largely did not flood but lost a sizable portion of their population, notwithstanding.
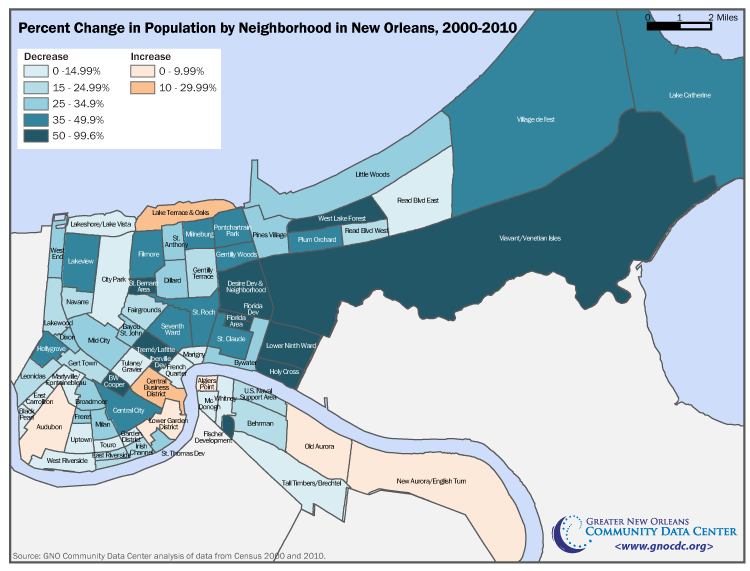
Among the 12 neighborhoods with the next largest rate of population loss (between 15 and 24 percent), Behrman, Irish Channel, and East Riverside did not flood but nonetheless lost 2,366, 897 and 521 residents respectively. The U.S. Naval Support area, which is under redevelopment, also falls into this category. The remaining eight neighborhoods flooded.
All 12 neighborhoods that lost from 26 to 34 percent of their population were significantly damaged by flooding with the exception of the St. Thomas housing project, which was demolished and redeveloped with fewer housing units as River Gardens.
Of the 14 neighborhoods that experienced 35 to 49 percent population loss, all experienced extensive flooding except the Bywater, which lost 1,759 residents despite limited flooding there.
The 12 neighborhoods that lost more than half their 2000 residents include seven major public housing sites that are currently under redevelopment. The remaining five neighborhoods, the Lower Ninth Ward, the Florida Area, West Lake Forest, Viavant/Venetian Isles, and Holy Cross all experienced extensive flooding in 2005.
Only seven neighborhoods gained population between 2000 and 2010. Old Aurora and Audubon had the largest numerical gains with over 950 additional residents each, followed by the Central Business District which gained 482 residents from 2000 to 2010.
Significant population loss has resulted in a dramatic increase in vacant housing. The 2010 Census counted 47,738 vacant homes in New Orleans.
The 2010 Census counted 189,896 housing units in New Orleans—25,195 fewer than in 2000—to some extent reflecting the demolitions that have taken place in recent years. However, to be counted as a housing unit, the Census Bureau requires that a residential building not be open to the elements—that is, it must have a roof, windows and doors protecting it. Some of the most severally dilapidated homes in New Orleans, therefore, are likely not included in this count of 189,896 total housing units. Thus, among the 25,195 reduction in housing units are likely some buildings, still in existence, that the Census Bureau considers too blighted to be counted as a housing unit.
Of the 189,896 housing units counted in New Orleans, 47,738 were counted as vacant—up from 26,840 ten years earlier. This represents a 2010 vacancy rate of 25 percent—a significant increase from the vacancy rate of 12 percent according to Census 2000. Because many New Orleans houses that were destroyed by the flooding of 2005 are now boarded up and not open to the elements, these likely account for a large portion of the increase in vacant homes from 2000 to 2010. As such, the Census 2010 count of vacant housing units is one indicator of blight across the city.
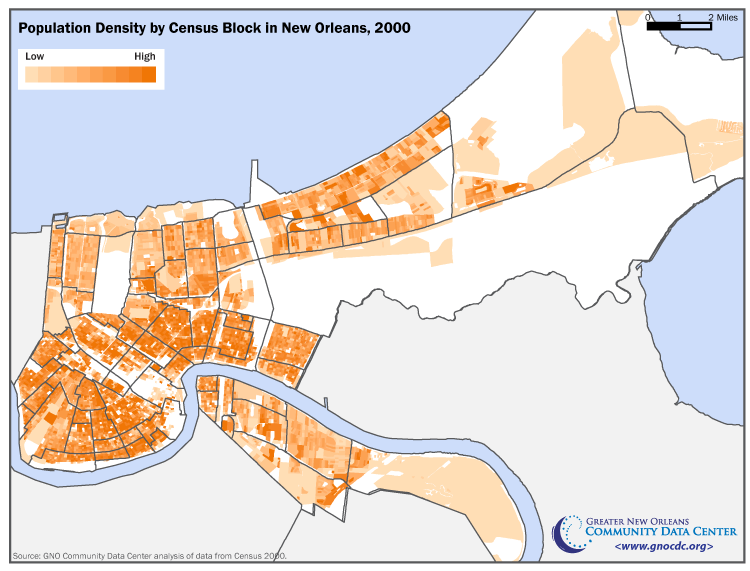
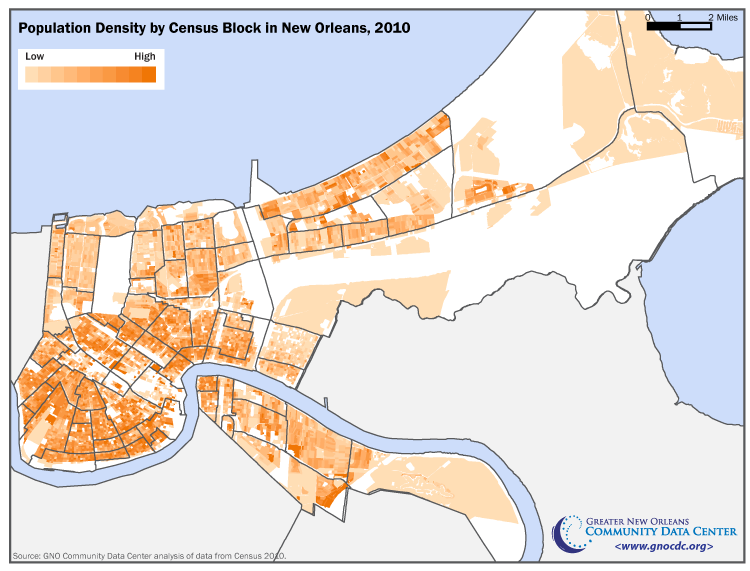
As depicted in the following maps, the density of vacant housing units in 2010 is greatest in a swath of flooded neighborhoods that were largely distressed before Katrina—in the older portions of the city from the Jefferson Parish line to the Industrial Canal, riverside of the Gentilly Ridge. Together Leonidas, Mid–City, Central City, Treme, Seventh Ward, St. Roch, and St. Claude account for 13,391 vacant housing units, or 28 percent of the vacant homes in the city.
But the newer, more suburban sections of the city now account for a significant number of vacant homes. New Orleans East, including Planning Districts 9, 10 and 11, contains 6,706 vacant houses albeit more spread out, on larger lots, than in the older portion of the city. Gentilly, or Planning District 6, contains 3,784 vacant homes and Lakeview, or Planning District 5, contains 2,219 vacant homes — again less densely situated than in the older sections of the city.
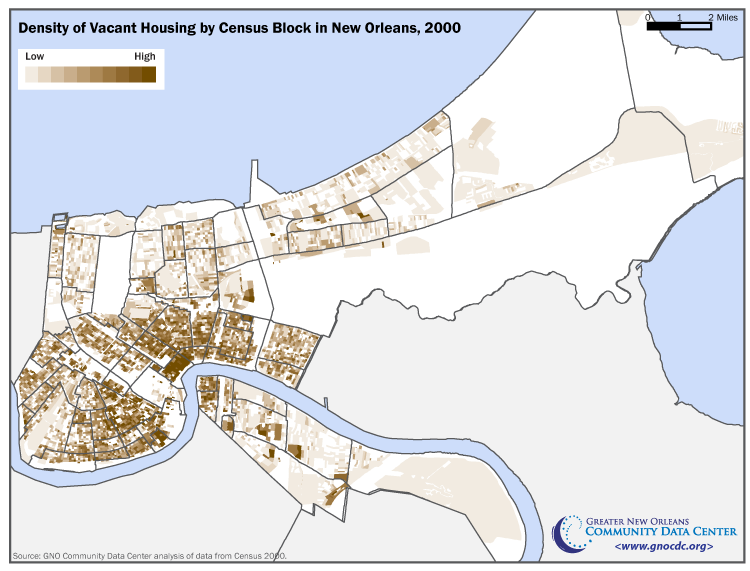
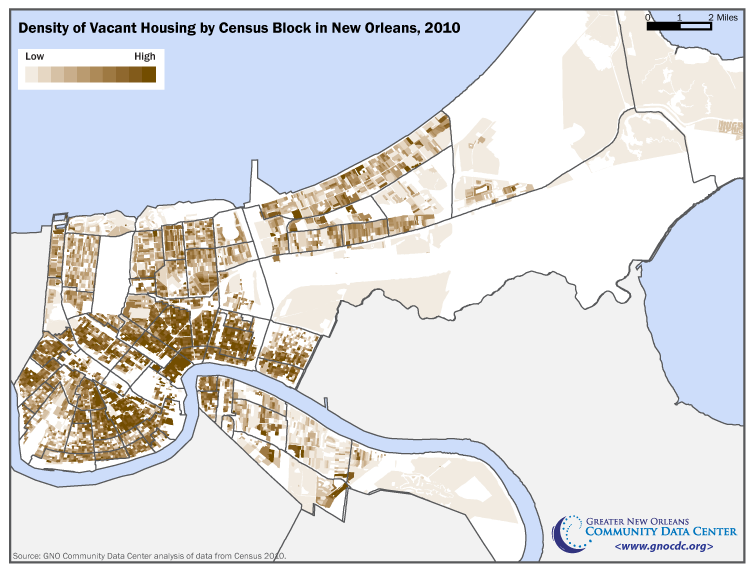
Source: The Data Center analysis of data from Census 2000 and 2010 and USGS National Landcover Database 2001.
*Population of two blocks (bordered by Derbigny St. on the north, Claiborne Ave. on the south, Cleveland Ave. on the west and Iberville St. on the east) are included in the Central Business District in 2000, and in Tulane/ Gravier in 2010.
**Population for the “Desire Area” and “Desire Development” neighborhoods is summed together as the “Desire Dev and Neighborhood” due to changes in 2010 census tract boundaries.
Limitations of the decennial census
Studies of the accuracy of the Census 2010 count will not be undertaken until more Census 2010 data has been released. However, studies of earlier decennial censuses provide guidance as to likely limitations of the Census 2010. A state–specific study of the Census 2000 undercount conducted by PricewaterhouseCoopers concluded that Louisiana’s population in 2000 was undercounted by 60,698 or 1.34 percent [2]. Studies of both the 1990 and 2000 decennial censuses concluded that American Indians, Asians, African Americans, Hispanics, and children were most likely to be undercounted [3]. And a study of the 2000 decennial census concluded that some people were double counted, including college students living away from home, and families counted at both their main and vacation homes. These people were more likely to be white and higher–income [4].
[1] Such as former public housing sites and the U.S. Naval Support Area, which have lost populaton due to demolition and redevelopment.
[2] PricewaterhouseCoopers, “Effect of Census 2000 Undercount on Federal Funding to States and Selected Counties, 2002–2012,” August 7, 2001, accessed online at http://govinfo.library.unt.edu/cmb/cmbp/reports/080601.pricewaterhouse/state_la.asp.htm
[3] Edmonston, Barry. “The Undercount in the 2000 Census,” The Annie E. Casey Foundation and The Population Reference Bureau, May 2002, accessed online at http://www.aecf.org/upload/publicationfiles/undercount%20in%202000%20census.pdf
[4] Ericksen, Eugene. “An Evaluation of the 2000 Census and Census Bureau Efforts to Measure the Gross and Net Rates of Undercount,” 2001. North Dakota Law Review, 77 (753).
Suggested Citation: The Data Center analysis of U.S. Census Bureau, Decennial Census