![]()
Home ![]() Pre Katrina Home
Pre Katrina Home ![]() Articles
Articles ![]() Mapping bicycle resources
Mapping bicycle resources
 Mapping
bicycle resources
Mapping
bicycle resources
A useful map carries a powerful safety message for
the Tulane community
A well-designed
resource map can help a community take advantage of its assets. Learn
how this process might apply to your own neighborhood work.
![]()
| by Denice Warren Ross & Allison Plyer |
August 17, 2003 | Potholes, puddles, narrow streets and drivers with one hand on their “go cup." Bicycling in New Orleans can be downright intimidating!
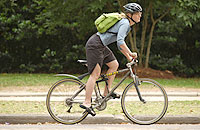
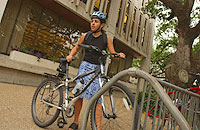 © Tulane University A
student prepares to pedal off to class.
|
Tulane University’s Office of Environmental Affairs is trying to increase bike ridership in the Tulane community as a less polluting method of getting around. Equally important, bike riding is a great source of inexpensive physical activity.
So how do you get more people safely on bikes, in a biking-tough city like New Orleans?
Audrey Warren, a graduate student in Tulane’s School of Public Health, had the idea to make a map of bicycling resources. Her theory of change was that a well-designed resource map with safety tips would decrease barriers to bike-riding. And her theory was based on a lot of good research.
|
The more thought that goes into making a map, the less work the audience has to do to use it. |
She and Ms. Liz Davey, Tulane’s Environmental Coordinator, brought their map idea to us at the Community Data Center. We thought this was a great use of mapping. We started by suggesting they get really clear on who their audience was and what they wanted the map to communicate. Together we determined a process for assembling all the information, and then we created the final product.
1. The Audience...
They decided to design the map for all students going to school at Tulane’s uptown campus. That meant that we would need to ensure that the map reflected the world as Tulane students see it, and also that it was easy to photocopy.
The Bicycle Resource Map is being distributed at a number of orientation programs for new students, including “Being Safe in the Big Easy,” attended by almost all new freshman – so thousands of copies will need to be made.
2. The Purpose...
A resource map is typically designed to inform and influence behavior. The more clearly the purpose of a map is articulated, the more effective it can be.
Based on Audrey's theory of change, the Tulane team decided this map would have two purposes:
- To inform students
about where to find nearby bicycling resources – where to buy used
and new bikes, get bikes serviced, get air for their tires, and buy
accessories like helmets and lights.
- To provide useful tips for riding in New Orleans, and practical rationale for safety basics like wearing a helmet.
3. The Process...
Involve
the audience in the process
It
was essential to have students on the project – they are, after all,
the audience for the map! Relying on their knowledge, we created a base
map that covered the campus area and labeled the streets and landmarks
that students refer to most.
Do
the footwork to put all the information in one place
Because resource maps are only as good as the data that
goes into them, Audrey looked for a reliable listing of bicycling resources
around Tulane.
|
A map is only as good as the data that goes into it . |
|
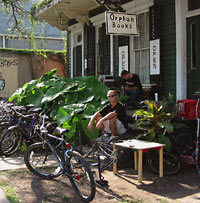 © GNO Community Data Center Orphan
Books also sells bikes (although you wouldn't know it from just
looking in the Yellow Pages).
|
She found the online Yellow Pages at yp.bellsouth.com to be a good source for bike stores. But, no surprise, the Yellow Pages didn't provide all the information necessary. It didn’t list gas stations that had air pumps, for example. And who would've thought that Orphan Books also sold bikes? Or that pawn shops can be a great place to get a good deal on a used bike?
So the students on the bicycle planning team talked to area cyclists about where they go for resources and cycled around uptown to add to the data from the Yellow Pages. They gathered the information they thought a student would need to be able to use each resource (location, phone number, hours of operation, etc.).
One challenge about getting such detailed, up-to-date information is that you need to have a plan for keeping it timely. The Office of Environmental Affairs committed to revising the map each year so it will continue to be a useful tool for students.
Organize
the information into meaningful categories
Before making
the map, the students had to organize the information. They
came up with useful categories for the different types of resources (new
bike shops vs. air pumps, for example). They
collected all the information in a spreadsheet like this so we at the
Data Center could place the resources on a map:
We carefully squeezed that information on to the map, like this:
Make
the message relevant
Audrey researched the best safety messages from the national
bike safety movement and adapted them to be locally relevant. Take, for
example, this safety message about wearing a light at night:
Acknowledge
potential barriers
New Orleans can be a really tough place to ride a bike
safely, and the bicycle planning team knew they'd lose credibility if
they portrayed New Orleans as a cycling utopia.
The planning team wrote the text on the map to acknowledge the challenges of bike riding in New Orleans, and offer concrete tips on how to adapt to these challenges.
For example, anyone who's been in uptown New Orleans for any amount of time knows that Magazine Street isn't the best place to be safely riding a bike. The narrow, curving street is lined with busy shops and on-street parallel parking. Camp Street, though, one block lakeside, is wider and residential.
4. The Product...
|
|
In the finished product, every single inch of the page is designed to serve the needs of the audience.
Will the map make a difference?
We put a lot of work into the map, but so what? The real question is, will it increase bicycle ridership (and especially safe bike riding)?
To answer this question, the Office of Environmental Affairs has baseline data on bicycle ridership on campus and also on how many riders wear helmets (the most visible manifestation of students bicycling safely). They plan to conduct the same studies again after distributing the map to see if the map had the desired effect.
|
If you're a New Orleans area nonprofit or community-based organization and would like to make a neighborhood resource map, the Community Data Center can help. Read the guidelines below, get your ideas for the map together, and fill out our Technical Assistance form to start the process. |
Making a resource map of your own
Resource maps like this bike map can be an efficient way to encourage people to take advantage of assets (especially under-utilized ones) that already exist in your neighborhood.
If you're inspired by this story, here are some guidelines for creating a useful resource map around an issue that matters in the neighborhood you serve:
| Guidelines for creating a resource map | |
| Theory of change |
|
| Audience |
|
| Purpose |
|
| Process |
|
![]()
This article is a collaboration between the Greater New Orleans Community Data Center (GNOCDC) and the Tulane Office of Environmental Affairs. Denice Ross is the Information Systems Designer at GNOCDC and Allison Plyer is a Senior Consultant. Maps created by Joy Bonaguro, GNOCDC's Web and Data Production Coordinator.
About
this bicycling initiative...
 The
Bicycle Resource Map was created as part of a partnership between Tulane
University (Bike.Tulane.edu) and
the New Orleans Regional Planning Commission (www.norcp.org)
to develop ways of teaching bicycle safety through the large institutions
(such as universities). The program is funded by the National Highway
Traffic Safety Administration, which last year gave grants to five projects
that would help implement the National
Strategies for Advancing Bicycle Safety.
The
Bicycle Resource Map was created as part of a partnership between Tulane
University (Bike.Tulane.edu) and
the New Orleans Regional Planning Commission (www.norcp.org)
to develop ways of teaching bicycle safety through the large institutions
(such as universities). The program is funded by the National Highway
Traffic Safety Administration, which last year gave grants to five projects
that would help implement the National
Strategies for Advancing Bicycle Safety.
Over the last two years, the the Regional Planning Commission has been developing a Bicycle and Pedestrian Master Plan for our five parish region. When completed, the Master Plan will be a thoughtful checklist of the policies, programs and physical infrastructure needed to fully incorporate bicycles our transportation system. For more information, contact Karen Parsons, bicycling coordinator for the RPC, at [email protected]
Home ![]() Pre Katrina Home
Pre Katrina Home ![]() Articles
Articles ![]() Mapping bicycle resources
Mapping bicycle resources
![]()
|
Greater New Orleans Community Data Center
Last modified: August 14, 2003 |