![]()
Home ![]() Pre Katrina Home
Pre Katrina Home ![]() Articles
Articles ![]() You can't always get what you want
You can't always get what you want
 You can't always get what you want
When the data you want just isn't available, here's how to choose correlated data as a stand-in for the data you need.
![]()
by Allison Plyer with Denice Warren Ross |
Aug 2, 2005 | We all know that grants require data from reputable, official sources to demonstrate need for our programs. And this data is key to getting the funders interest because it appears first thing in the grant in the problem statement.
Most of the problems we are trying to address seem rampant in our communities and so getting data that demonstrates how rampant they are should be no problem. Right? Well, unfortunately, thats not always the case.
Although data is collected about many social problems in our country, there are several reasons why you may not be able to get the data you want about the community you serve:
- Data gathering is expensive, so researchers sometimes gather data only on a small nationwide sample. It’s not easy to use this kind of national data to determine how rampant a problem is locally.
- It’s also expensive to publish data, so although some data is collected locally, those who collect it may not have the resources to publish it on web sites or other media.
- And, some data is not published for geographic areas as small as a neighborhood because doing so could violate people's privacy.
So what should you do when you cant get the data you want?
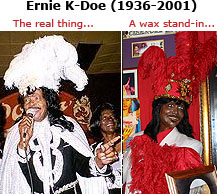 Photos courtesy of Ms. Antoinette K-Doe |
||
| Ernie K-Doe's stand-in, a wax sculpture, has made the rounds across town at the Kingsley House Fall Festival, Save Our Cemeteries' Mourning Glory Ball, and DramaRama at the Contemporary Arts Center. | ||
|
||
 Photo from Sense Scotland. Permission for use has been requested. |
||
| Be cautious when choosing a stand-in, and make sure there's research that substantiates a correlation between the stand-in and the problem you want to describe. | ||
When the data that directly describes the problem is not available, you need a good stand-in.
For example, data on adult literacy is not available for neighborhoods. However, educational attainment, which is available, makes a good stand-in because research shows that rates of adult educational attainment are strongly related to those of adult literacy.1
Technically speaking, what we're talking about here is called “correlation.” Two types of data are correlated when they tend to change at the same time. Correlation is not something you can judge for yourself — but instead it is a mathematical relationship that is proven through rigorous statistical processes.
Sometimes correlated data measure very similar concepts (like education and literacy) so it's no surprise that they move at the same time. And sometimes correlated data measure very different concepts (like poverty and obesity2), but still these data tend to change simultaneously.
Whether or not the data represent similar concepts, what you're looking for is a stand-in number that is statistically proven to be strongly related with the actual problem – despite the fact that it is not a direct measurement of the problem.
 Cautions:
Choose your stand-ins carefully. Sometimes grantwriters assume that certain data can stand in for the data they cannot find. For example, someone working on a traffic safety campaign might assume that high poverty means low rates of seat belt usage. But, there's not good evidence about the relationship between poverty and seat belt usage (because observational studies on seat belt usage can not assess the income of the users).3
In contrast, if you were writing about the need for greater access to health care in your neighborhood, you might describe the area's poverty. This works, because there is plenty of documentation that poverty is closely correlated with lack of access to health care.4
Document the connection. If you're using correlated data, you'll need to provide research that demonstrates its connection to the problem you are addressing. For instance, if you want adult educational attainment to stand in for adult literacy, be sure to document the research that substantiates the correlation. And if you want to use poverty to stand in for data on lack of access to health care, you must reference reliable sources that indicate these two indicators are related.
Be careful when using race. If you are tempted to use race to demonstrate need, be particularly careful. Race is certainly correlated with a number of problems like heart disease and stroke.5 But race is not highly correlated with many social problems. Domestic violence, for example, occurs across all racial groups equally.6 So asserting that the neighborhood where you work needs domestic violence services because it is 98% African American is not a convincing argument... and it may communicate lack of respect for the very people you intend to serve.
How to find research on correlated data
| Tips about search terms | |
Don’t type full questions. |
|
| Don’t use prepositions. | |
| Use words that are used by professionals in that field. (e.g., “academic achievement” instead of “kids doing well in school”) | |
| When searching for research studies, don’t include “New Orleans” in your search terms. | |
| Use quotation marks only when you want to find that specific string of words. |
The easiest place to find research that substantiates the use of related data is from the web sites of national associations working in your field. To find such web sites, use www.google.com and search terms such as access health care national association .
When you are on the web site of any such national organization, look for links to “facts,” “statistics,” “data,” or sometimes “information.” There you will likely find reports that indicate what demographics are closely associated with the problem you are trying to address.
You get what you need...
It's disappointing when you first realize that you can't get the data you want. Fortunately, with a little research, correlated data can stand in for that unavailable data. This stand-in data won't sing and dance like the real thing, but its presence can help make a compelling case for your program. And that is, after all... what you need.
Citations
1Adult Literacy and Education in America: Four Studies Based on the National Adult Literacy Survey from the U.S. Department of Educational Research and Improvement (2002).
http://nces.ed.gov/pubs2001/2001534.pdf
2Drewnowski, Adam and SE Specter. Poverty and obesity: the role of energy density and energy costs. American Journal of Clinical Nutrition, Vol. 79, No. 1, 6-16, (2004).
3Safety Belt and Helmet Use in 2002--Overall Results from the U.S. Department of Transportation National Highway Traffic Safety Administration (2002).
http://www-nrd.nhtsa.dot.gov/pdf/nrd-30/NCSA/Rpts/2002/809-500.pdf
4Health, United States, 2004: With Chartbook on Trends in the Health of Americans from United States Department of Health and Human Services, Centers for Disease Control and Prevention, National Center for Health Statistics (2004).
http://www.cdc.gov/nchs/hus.htm
5Progress Review: Heart Disease and Stroke from the United States Department of Health and Human Services - Public Health Service (2003).
http://www.healthypeople.gov/data/2010prog/focus12/
6Intimate Partner Violence: Fact Sheet from the National Center for Injury Prevention and Control. Centers for Disease Control and Prevention
(2004)
http://www.cdc.gov/ncipc/factsheets/ipvfacts.htm
![]()
Allison Plyer is the Research and Technical Assistance Manager and Denice Ross is the Information Systems Designer at Greater New Orleans Nonprofit Knowledge Works (a new organization formed in a merger between the Community Data Center and the Center for Nonprofit Resources).
The photograph of two sitting Elvis impersonators in the title of this article was found as a link off of this page at Game Revolution. (Permission for use has been requested.)
The photo of Ernie K-Doe was taken by Pat Jolly at the Mid-City Lanes Rock 'n Bowl during a fundraiser for Eddie Bo after his house burnt down in 2000. The wax sculpture of Ernie K-Doe was taken with verbal permission of Ms. K-Doe at the Mother-in-Law Lounge at 1500 N. Claiborne Avenue in New Orleans, Louisiana.
The photo of the dancing Elvis impersonators was taken at a fundraiser for the charity Sense Scotland, which supports children and adults with disabilities in Scotland.
Home ![]() Pre Katrina Home
Pre Katrina Home ![]() Articles
Articles ![]() You can't always get what you want
You can't always get what you want
![]()
Greater New Orleans Community Data Center Last modified: August 2, 2005 |