![]()
Home
![]() Lead
Poisoning Case Study
Lead
Poisoning Case Study
8. Need – compared to what
Back to the Internet, Mrs. Bell looked for an easy way to compare neighborhood data on the Community Data Center web site.
Looking around at the various links on that Housing page for the Central City neighborhood, she realized she could download a comparison table. It had all the neighborhoods for the entire parish, plus comparisons to state and national data!
One of the computer savvy children in her classroom knew how to use Excel and showed Mrs. Bell how to sort the neighborhoods in decreasing order of housing units built before 1950.
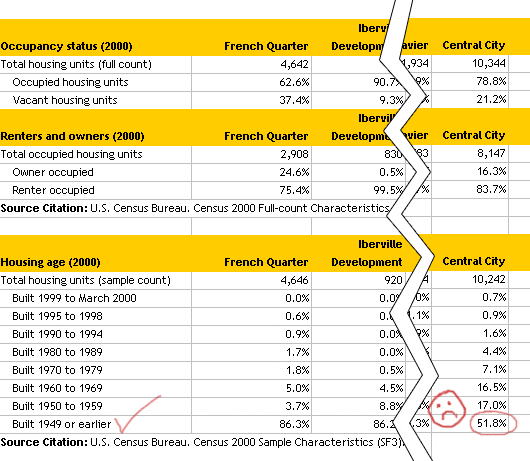
Bad news, there were 34 neighborhoods (out of 73 total in Orleans Parish) that had a higher percentage of housing units built before 1950.
But wait a minute, Central City was a much larger neighborhood than many of the others.
Most of the neighborhoods had a lot fewer housing units than did Mrs. Bell’s neighborhood. She used the spreadsheet to calculate the number of housing units built before 1950 in each neighborhood. Wow, that spreadsheet made calculations so easy! Then she resorted the table by number of housing units built before 1950 and now Central City had the largest number of housing units built before 1950.

Now Mrs. Bell felt certain she could make a strong case for the need for lead poisoning prevention in her community. On the next page, you'll see the final draft of her needs assessment.
![]() Next page: Final
draft of Mrs. Bell’s needs assessment
Next page: Final
draft of Mrs. Bell’s needs assessment
1, 2, 3,
4, 5, 6,
7, 8, 9, 10
Home
![]() Lead
Poisoning Case Study
Lead
Poisoning Case Study
![]()
|
Greater New Orleans Community Data Center
Last modified: April 10, 2002 |