The Coastal Index 2017
Published: Jun 14, 2017
With the update of the Louisiana Coastal Master Plan, the infusion of money from the BP settlement, and the existential issue of coastal land loss, Southeast Louisiana has the makings for a water management cluster. The Coastal Index 2017 measures economic, social, and political factors that have been shown to affect the formations of clusters in the U.S., as well as provides a roadmap for how leaders can build on strengths and address weaknesses to create a self-sustaining water management cluster that can become a long lasting economic driver for the region.
Executive Summary
In January 2017, the State of Louisiana’s Coastal Protection and Restoration Authority (CPRA) delivered the stunning news that its estimates for future land loss are now much grimmer than previously projected. Thousands of homes and businesses in coastal Louisiana will need to be floodproofed, elevated, or moved.[1]
Many states have significant coastal vulnerability, yet none of them are tackling this threat head-on at the scale Louisiana is. Ten years ago, the CPRA developed the country’s first Master Plan for Coastal Protection and Restoration. The plan is revised every five years, incorporating science-based solutions to counter Louisiana’s coastal land loss. Since 2007, the CPRA has made substantial progress on this plan, spending an average of nearly $800 million annually on innovative projects that have benefited over 36,000 coastal acres. Moreover, with at least $8.7 billion from the BP settlement, Louisiana will continue to spend hundreds of millions of dollars on coastal restoration and protection for the next 15 years.
There’s no doubt that this spending will generate thousands of “temporary” jobs – many of which will last for years.[2] Yet, the most important economic opportunity associated with the Master Plan is not the jobs it will generate over the next 15 years, but the possibility of leveraging these billions of dollars to develop a “water management” industry cluster that is self-sustaining.
Infusions of federal funds have catalyzed self-sustaining industry clusters before – most recognizably Silicon Valley, which was set in motion by military investment in radio technology during WWII.[3] On the other hand, federal dollars have failed to turn southern Virginia, with its heavy military presence, into a self-sustaining cluster.[4] The factors explaining these divergent paths were the presence or absence of supporting economic, social, and political forces.
To become a self-sustaining cluster, Louisiana must not only develop scientific preeminence in the field of flood risk reduction but also commercialize that science. From geotextiles, to oyster reefs, to massive civil engineering projects, to watershed monitoring and management, to new ways to manage subsidence – there are likely dozens of innovations in flood risk reduction that could be developed and marketed to bring in revenues from national and global markets that will soon face these challenges.
The Coastal Index 2017 quantifies some of the public and private investment already at work in Southeast Louisiana’s water management industry. It then measures economic, social, and political factors that have been shown to affect the formations of clusters in the U.S. — revealing strengths and weaknesses in the state’s ability to create a self-sustaining cluster. Our findings are as follows:
THE DEMAND DRIVERS OF SOUTHEAST LOUISIANA’S WATER MANAGEMENT INDUSTRY REPRESENT BILLIONS OF DOLLARS OF INVESTMENT.
- Nearly $8 billion was spent from 2007 to 2016 by CPRA and partner agencies on master plan projects.
- From 2010 to 2016, the CPRA awarded an annual average of $61 million [5] in regular services contracts, and an annual average of $124 million in construction contracts from 2007 to 2014.
- The Army Corps awarded an annual average of $27 million in services contracts and $399 million in construction contracts between 2010 and 2014.
- The CPRA is planning to spend $1.3 billion on construction contracts, $302 million on services contracts, and nearly $105 million on operation, maintenance, and monitoring costs from FY 2018 to FY 2020.
- Notably, CPRA’s administrative costs are very thin – averaging only 6 percent from FY 2018 to FY 2020.
THE WATER MANAGEMENT CLUSTER IS CURRENTLY A HYBRID OF HUB-AND-SPOKE AND SATELLITE PLATFORM STYLE DISTRICTS.
- From 2010 to 2016, Louisiana firms secured 83 percent of all Army Corps services contract dollars in Louisiana and 79 percent of all Army Corps construction contract dollars in Louisiana.
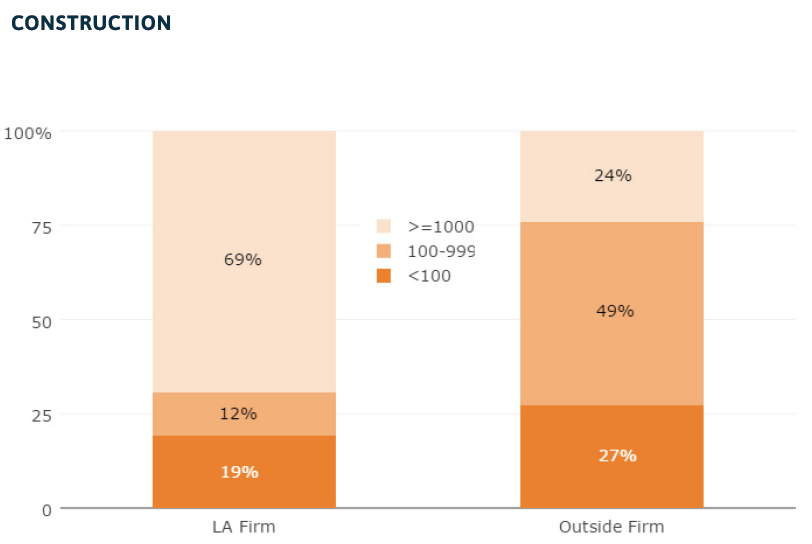
- Of all Army Corps construction contract dollars in Louisiana that went to Louisiana firms from 2010 to 2016, 70 percent went to large companies with more than 1,000 employees.
- From 2010 to 2016 Louisiana firms secured 49 percent of all CPRA regular services contracts and 61 percent of all construction contract dollars.
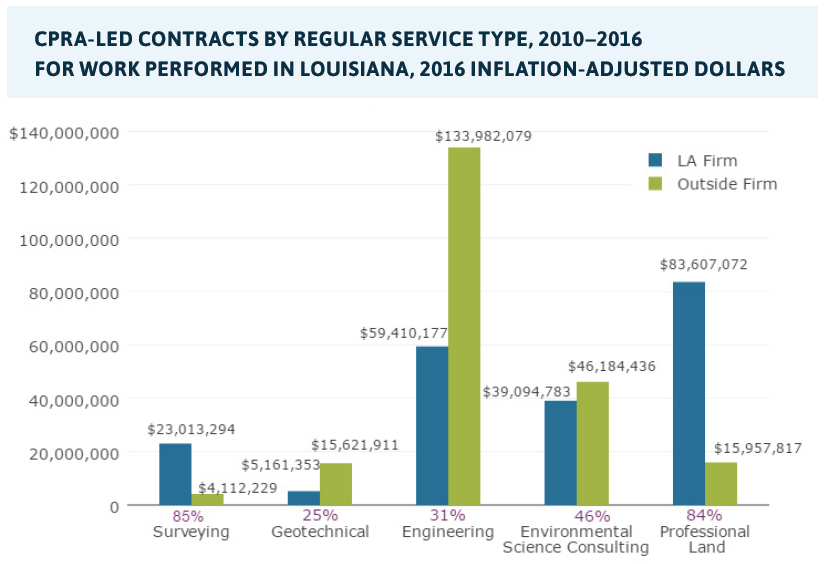
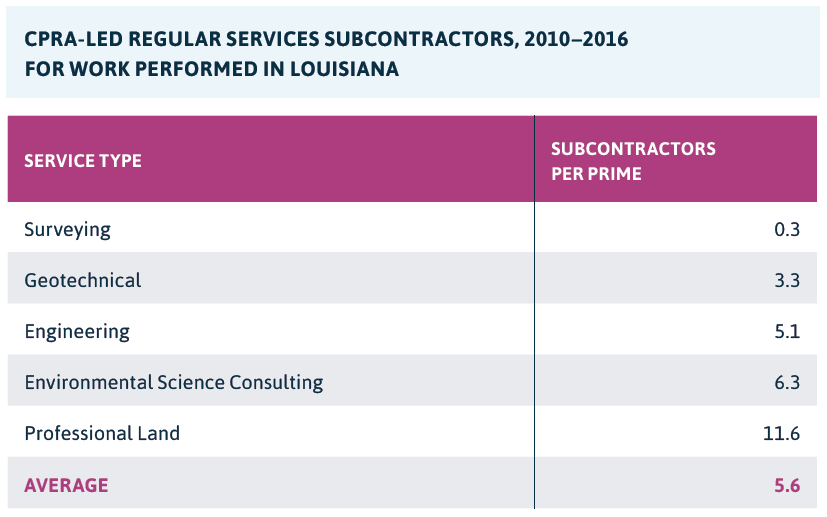
- Louisiana firms were more likely to win CPRA regular services contracts for surveying and professional land services and less likely to receive contracts for engineering, environmental sciences consulting, and geotechnical services from 2010 to 2016.
LOUISIANA WATER MANAGEMENT FIRMS ARE INCREASINGLY COMPETING OUTSIDE THE STATE. STILL, LOUISIANA FIRMS HAVE ROOM FOR GROWTH IN TAPPING OTHER MARKETS.
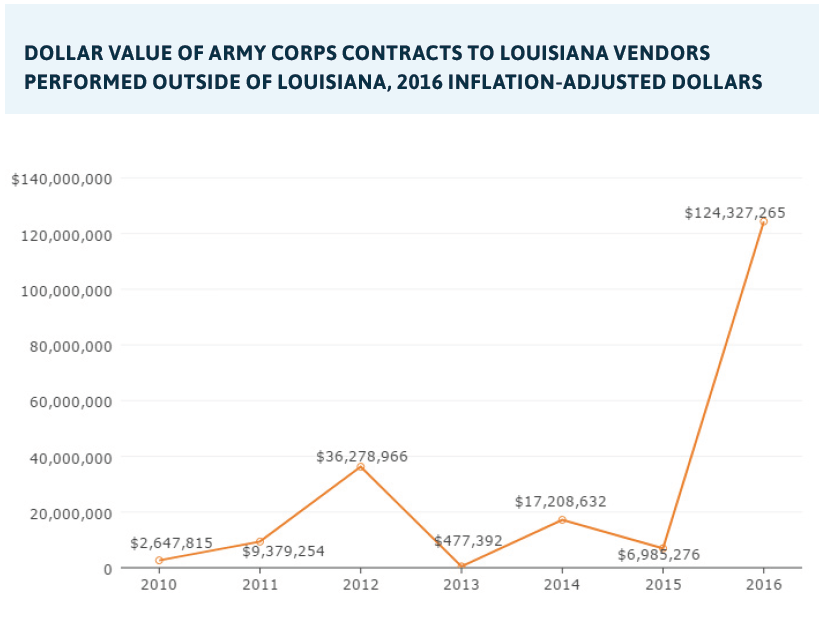
- Louisiana firms captured an average of $12 million per year in Army Corps contracts outside Louisiana from 2010 to 2015. In 2016, the amount of funding Louisiana firms secured in out-of-state Army Corps contracts surged to over $124 million.
- The market potential for Louisiana firms is substantial. Notably, Army Corps contracts spiked to over $4 billion outside of Louisiana in 2016.
EDUCATED WORKERS NEEDED TO FUEL INNOVATION ARE IN SHORT SUPPLY IN SOUTHEAST LOUISIANA.
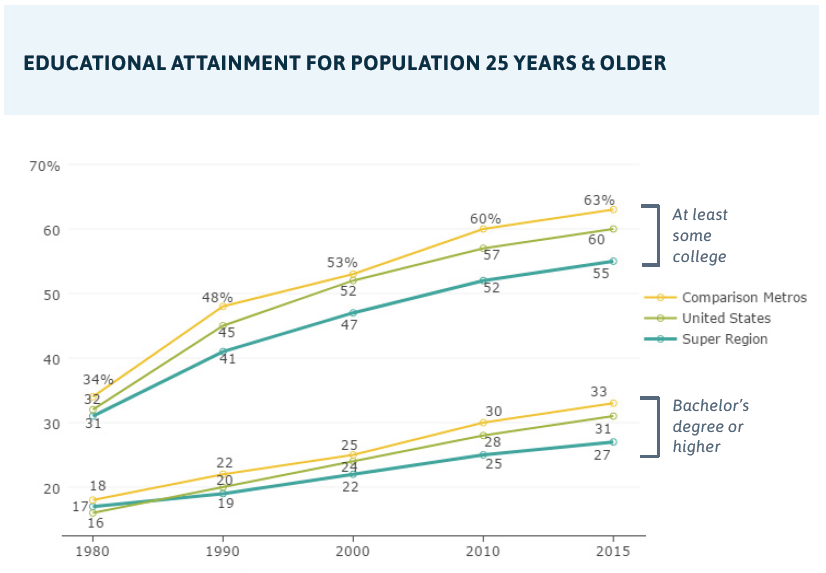
- Southeast Louisiana lags behind the United States in educational attainment, with only 27 percent of adults 25 years and older holding a bachelor’s degree or higher. In contrast, metros competing in this sector had 33 percent of adults holding a bachelor’s degree or higher—above the national average.
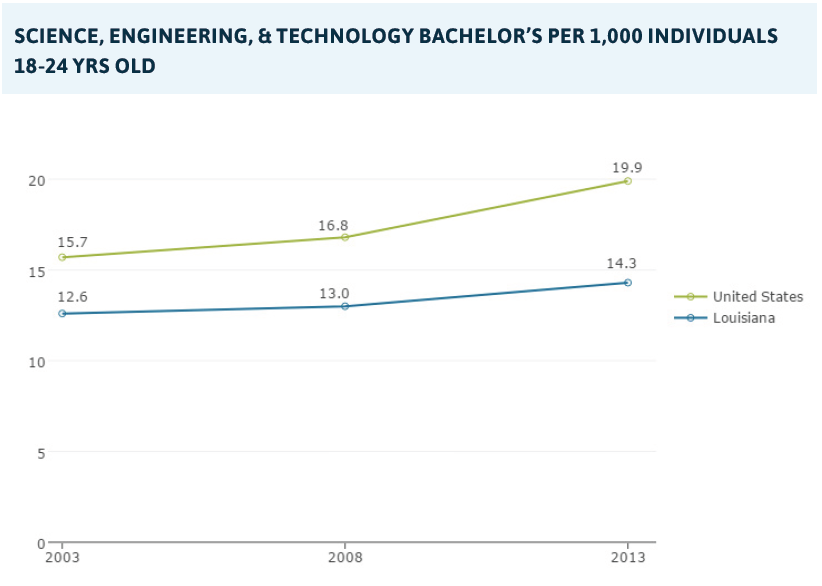
- Louisiana’s share of recent science, engineering, and technology graduates is only 14.3 per 1,000 individuals 18-24 years old as compared to 19.9 nationwide.
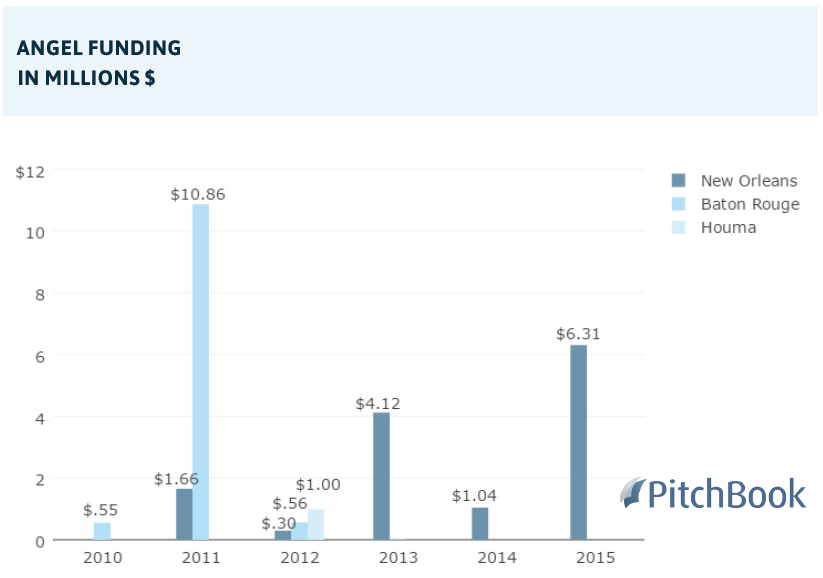
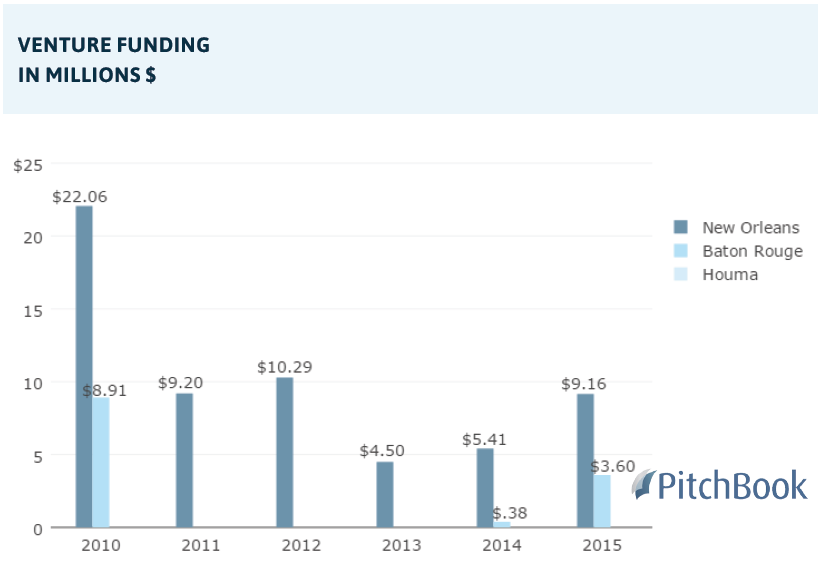
NEW ORLEANS HAS HAD GROWING SEED, ANGEL, AND VENTURE CAPITAL INVESTMENTS MORE SO THAN BATON ROUGE OR HOUMA. WHILE ACADEMIC RESEARCH AND DEVELOPMENT DOLLARS HAVE PLUMMETED IN LOUISIANA, STATE AGENCY R&D HAS GROWN.
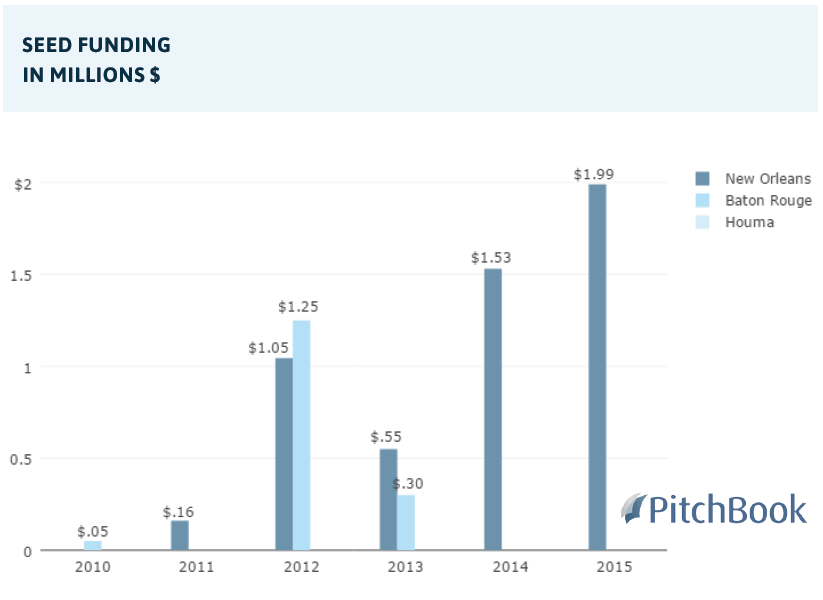
- New Orleans based companies have benefited from growing (albeit still small levels of) seed funding from $160,000 in 2011 to $1,990,000 in 2015, as well as angel deals that have reached $6,305,000 by 2015 and venture capital deals of more than $9,160,000 in 2015. In contrast, Baton Rouge firms have had scant angel or seed funding since 2013, and only $3,600,000 in venture capital deals in 2015.
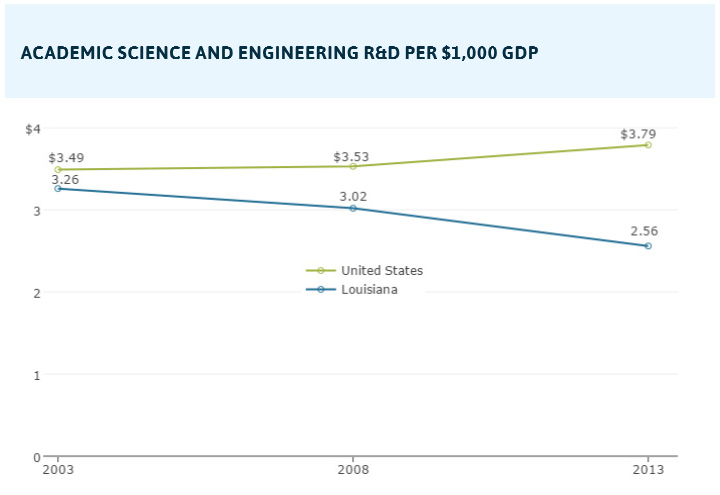
- Funding for Louisiana’s academic science and engineering R&D has fallen to $2.56 per $1,000 GDP, well below the national average of $3.79. In contrast, state agency R&D funding has increased to $64 per $1 million GDP which may reflect the growing work of The Water Institute of the Gulf.
MUCH OF SOUTHEAST LOUISIANA’S RESEARCH MAY NOT BE CONVERTED INTO MARKETABLE PRODUCTS, AS THE RATE OF PATENTING IN THE SUPER REGION IS EXCEEDINGLY LOW.
- As compared with metros that compete in water management, the Super Region had the lowest annual average of patents applied for and granted per million residents from 2007 to 2011 at just 81. The next lowest metro was Tulsa where 154 patents were granted, on average, each year per million residents. At the high end, Houston had 370, Cleveland had 443, and Portland had 828.
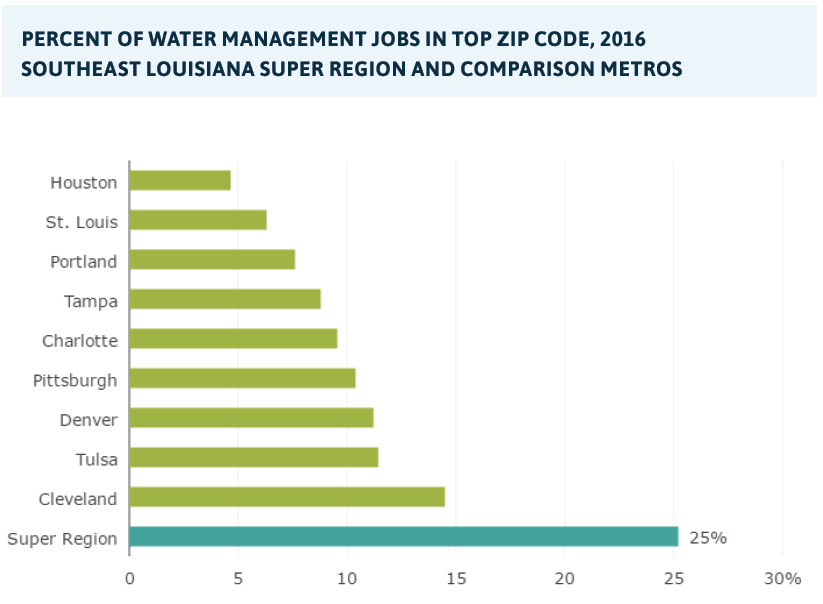
THE SUPER REGION HAS A HIGH CONCENTRATION OF WATER MANAGEMENT JOBS WITHIN ITS TOP ZIP CODE RELATIVE TO COMPETING METROS. HOWEVER, THE TOP FIVE WATER MANAGEMENT ZIP CODES ARE SPREAD ACROSS THE BATON ROUGE AND NEW ORLEANS METROS.
- Fully 25 percent of the Super Region’s water management jobs are in one ZIP code in Baton Rouge, and 41 percent of all water management jobs are in the top five ZIP codes, which are split across the Baton Rouge and New Orleans metros.
GREATER PHILANTHROPIC SUPPORT FOR ENVIRONMENTAL ORGANIZATIONS WILL BE IMPORTANT FOR INCREASING CIVIC CLOUT AND FOSTERING IDEA EXCHANGE IN SUPPORT OF WATER MANAGEMENT.
- Grant-giving to environmental organizations in Southeast Louisiana has fallen from $3.05 per capita in 2012 to $2.13 in 2014.
THIN STATE FUNDING FOR COASTAL RESTORATION AND PROTECTION AND RAPIDLY DECLINING STATE FUNDING FOR HIGHER EDUCATION MAY BECOME BARRIERS TO GROWING THE CLUSTER.
- Of the nearly $8 billion spent from 2007 to 2016 by the CPRA and partner agencies on coastal master plan projects, 98 percent came from federal sources, and only 2 percent came from state coffers.
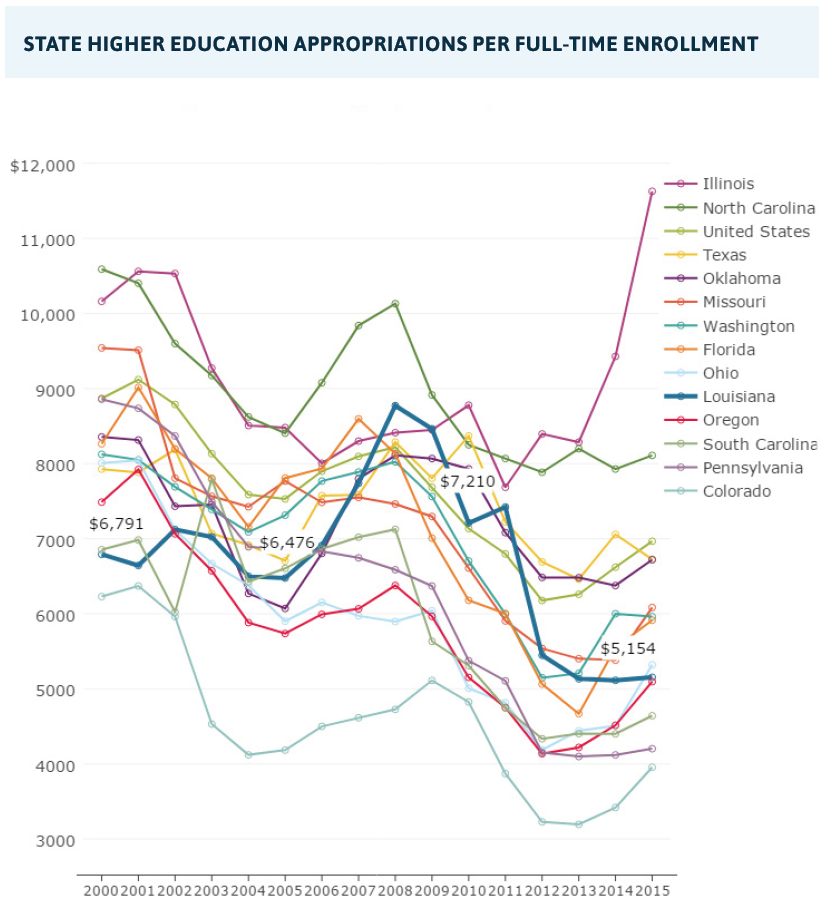
- State higher education appropriations per full-time student fell from $7,210 in 2010 to $5,154 in 2015. Other states also have had declining levels of funding; Colorado, Pennsylvania, South Carolina, and Oregon all had lower levels of higher education appropriations per student than Louisiana in 2015.
CONCLUSION
With substantial federal funding, an existing strength, and many engaged stakeholders, water management has the raw ingredients to become an economic powerhouse in Southeast Louisiana. Leaders must commit to long-term strategies to develop supports for this cluster—supports that have proven critical in the formation of every cluster that is driving today’s prosperous regional economies.
Economic development leaders across the Super Region have begun the work of establishing a cluster by – among other things – working to attract engineering companies to Baton Rouge, and encouraging colleges and universities to develop curricula that prepare students for jobs in water management. These are important early steps in forming a cluster. However, for the Super Region to develop a world-recognized cluster, leaders’ efforts need to be guided by a comprehensive set of long-term goals and strategies.
The dearth of educated workforce in Southeast Louisiana will continue to be an obstacle to growing the cluster. Businesses will need to both attract workers from elsewhere via higher wages, and build the skills of the local workforce to fully staff these projects. Attracting and developing the needed workforce will become increasingly important as a wave of baby boomer retirements will cause greater worker shortages in the near future.[6] The state has demonstrated little appetite for investing in higher education, and businesses may not be able to rely on public institutions to supply a skilled workforce. The comprehensive plan to grow this cluster should include innovative private-sector solutions that recognize this reality. Public-private partnerships, such as the recent effort to streamline federal permitting around environmental reviews for restoration projects, can help to address uncertainties created by regulations that stymie private industry’s ability to invest in workforce development.
The comprehensive plan to develop the cluster should also include strategies that grow Louisiana businesses and encourage businesses from outside the state to establish branch offices in Louisiana. Tight clustering of businesses is essential because it promotes healthy competition and collaboration, and increases the ability to solve problems. Demand drivers of water management can support this effort by splitting or “unbundling” contracts into smaller more attainable amounts prior to the proposal stage. This will not only ensure more Louisiana businesses can bid on the contracts, it will also reduce the motivation for out-of-state companies to bid. Demand drivers and business development organizations can host strategic networking events between successful large companies and smaller Louisiana companies to specifically catalyze new mentoring and subcontracting relationships. Importantly, demand drivers should publish data after contract completion on the dollars that actually flowed to subcontractors to ensure that the proposed local share is being met.
Essential to the comprehensive plan will be strategies for commercializing Louisiana’s cutting edge science for reducing future flood risk. Scholars in key institutions, such as The Water Institute of the Gulf and the many universities in the Super Region, must begin to ponder the economic potential of their research. Scientists should work directly with entrepreneurs and local companies who can help them commercialize their inventions. Academic institutions must begin to see the scholarship that happens within their walls as a prime source of innovation needed to spur economic growth in the region.
Incubators have flourished in Southeast Louisiana post-Katrina, and “pitch” contests are frequent. Incubators could host “reverse pitches” in which larger water management companies pitch their needs to startups, thereby generating new ventures closely related to larger companies—a dynamic that will be key to the water management cluster’s formation. With growing pools of funding in New Orleans and major research institutions in Baton Rouge, the SoLA Super Region Committee can play a critical role in advocating for strategies that link the region together and connect investors with inventors.
Clusters take years to develop, and therefore efforts toward building a water management cluster in Southeast Louisiana must be sustained. Moreover, critical to the development of any cluster is the ability of federal, state, and local government, civic organizations, academic institutions, and large and small companies all to work together toward a single goal. The development of a water management cluster should be the focus of that goal as it is likely Southeast Louisiana’s best bet to grow the state’s economy for the long haul. Done well, Southeast Louisiana can truly turn its biggest challenge into its greatest opportunity.
Demand Drivers
- Coastal Protection and Restoration Authority (CPRA)
- U.S. Army Corps of Engineers (Army Corps)
- Mitigation Banks
-
WHAT IS THIS DEMAND DRIVER?
The Coastal Protection and Restoration Authority (CPRA) is a state agency that is tasked with implementing a comprehensive restoration and protection plan to protect the Louisiana coast.
WHAT TYPE OF WORK DOES IT DO?
The CPRA plans coastal restoration and protection projects that align with coastal master plans revised every five years. But, the CPRA does not lead every project it administers. The CPRA actually allocates to partner agencies the money and authority to lead many master plan projects. The CPRA may plan and design portions of the partner-led projects, but implementation is left to the partners—including the U.S. Army Corps of Engineers and local municipalities, such as Lafourche Parish, Plaquemines Parish, and Cameron Parish— that award contracts to companies. Other master plan projects are fully led by the CPRA, itself, which also awards contracts to companies directly.
WHAT TYPES OF WATER MANAGEMENT CONTRACTS DOES IT AWARD?
The CPRA divides its contracting into two types: construction and services. Construction contracts go through a state open-bid process through which the lowest bid is selected, according to state law. Companies that receive contracts directly from the CPRA are “primes.” These primes then, in turn, contract out some project components to subcontractors, or “subs.”
Services contracts are entirely different from construction contracts. CPRA puts out RFPs or RSIQs for certain regular services about every 18 to 24 months. These regular services are as follows: environmental science consulting, engineering, geotechnical, surveying, and professional land services. For each RFP/RSIQ, upwards of five to ten companies often win what are three-year IDIQ contracts (the maximum allowed by the State), which generally range from $3 to $5 million. IDIQ stands for “Indefinite Delivery, Indefinite Quantity,” which means that the full amount of the contract may not be realized. CPRA issues to contract winners relatively small task orders for services, and task orders vary in their application as needed. A task order can apply to one master plan project or multiple master plan projects. Over the course of a contract, as an example, a given professional land services company may receive ten $200,000 task orders across a range of projects. Regular services are also a component of the planning process. Thus, some task orders may not be associated with a specific project at all or may be associated with partner-led master plan projects. Like construction contracts, a prime-sub hierarchy exists within services contracts. Recently, the CPRA has begun to issue limited service IDIQ contracts that are smaller and allow smaller firms the opportunity to serve as prime contractors. The CPRA has also begun to issue project-specific, rather than IDIQ, RSIQs in the past year.[1]
WHAT DOES THE DATA SHOW?
CPRA awarded $61 million in average annual regular services contracts between 2010 and 2016. However, these may not be fully realized because of the indefinite nature of IDIQ services contracts the CPRA typically uses. CPRA awarded $124 million, on average, in construction contracts each year from 2007 to 2014. Construction contracts were a substantially larger portion of CPRA contracts than regular services contracts.
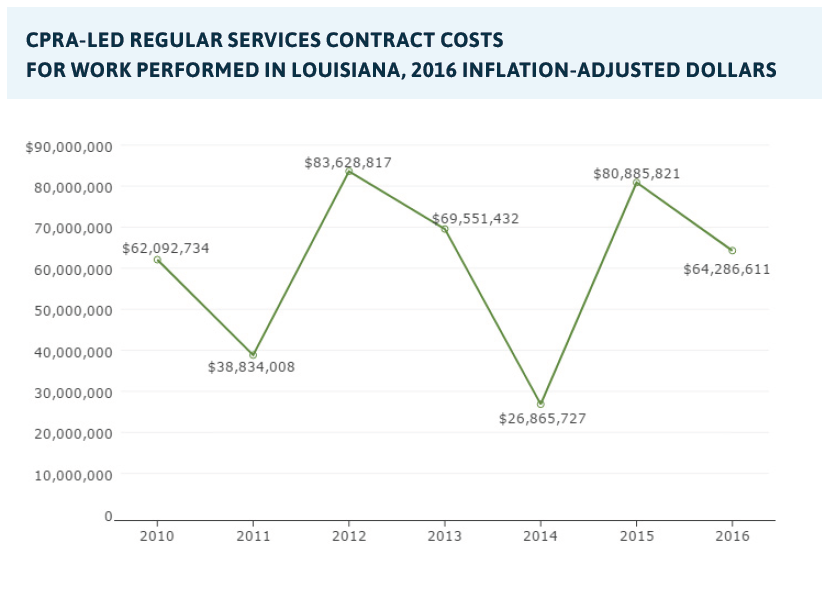
Source: The Data Center analysis of data gathered from CPRA IDIQ services contracts and LaTrac.
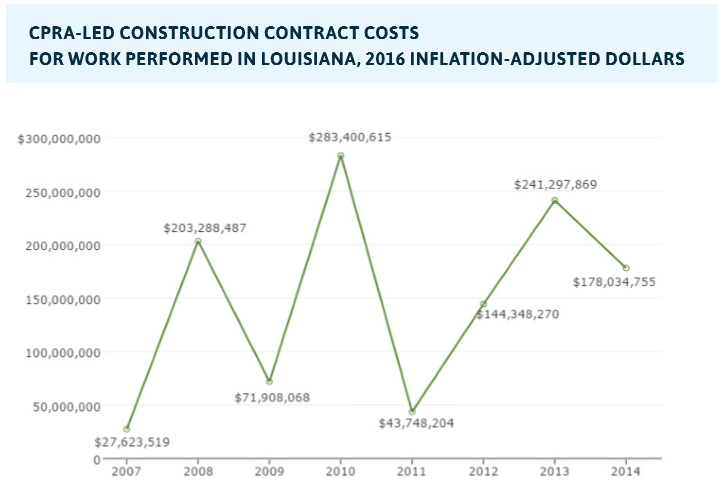
Source: The Data Center analysis of data gathered from CPRA completion reports, cash transfer data gathered by GNO Inc., and internal CPRA project data.
Looking ahead, nearly $2 billion in planned projects are funded, in part, for construction or design between FY 2018 and FY 2020. In the Fiscal Year 2018 Annual Plan, the CPRA projects construction costs of $383 million in 2018, $113 million in 2019, and $818 million in 2020. The CPRA predicts services costs (including planning and engineering and design) of $137 million in 2018, $120 million in 2019, and $45 million in 2020. The CPRA also predicts significant operation, maintenance, and monitoring costs averaging $35 million annually over the next three years. Notably, CPRA is considered lean in terms of administration with an average of only 6 percent annually in administrative costs for the foreseeable future.
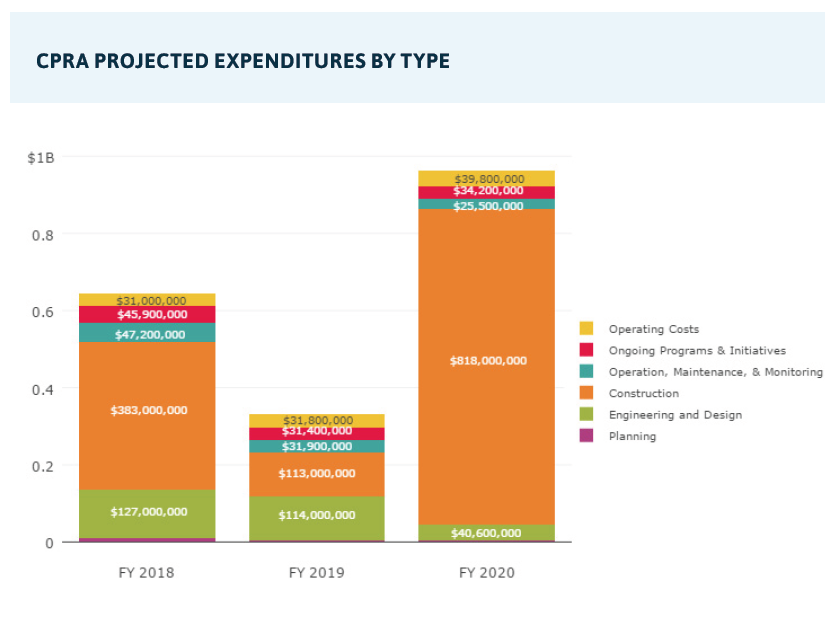
Source: Coastal Protection and Restoration Authority, “Fiscal Year 2018 Annual Plan, Section 4: Projections.”
-
WHAT IS THIS DEMAND DRIVER?
The U.S. Army Corps of Engineers (Army Corps) is a division of the Department of the Army that implements large water infrastructure projects and, in the context of water management, conducts a large share of coastal protection work.
WHAT TYPE OF WORK DOES IT DO?
The Army Corps’ work includes coastal protection and urban water management. It leads some projects that fall under the Master Plan, including the Hurricane and Storm Damage Risk Reduction System (HSDRRS) surrounding New Orleans. The Army Corps awards contracts associated with these projects and does some planning (although, much of the planning associated with these Army Corps projects is done by the CPRA). Outside of CPRA programs, the Army Corps funds and administers some of its own programs in Louisiana. The Southeast Louisiana Urban Flood Control Project (SELA), for example, is a program that supports Southeast Louisiana parishes’ master drainage programs with Army Corps funded and implemented construction projects. In addition to its own and CPRA-originated programs, the Army Corps also maintains canals, pumps, spillways, floodwalls, and levees throughout South Louisiana.
WHAT TYPES OF WATER MANAGEMENT CONTRACTS DOES IT AWARD?
Because a substantial portion of Army Corps work is implementing projects that are already planned (e.g., CPRA master plan projects), their water management contracts tend to mostly be in construction products and services.
WHAT DOES THE DATA SHOW?
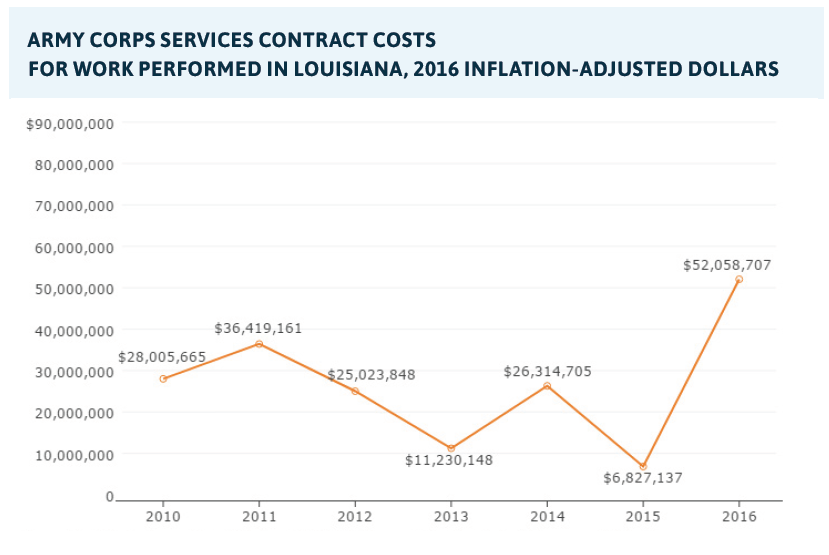
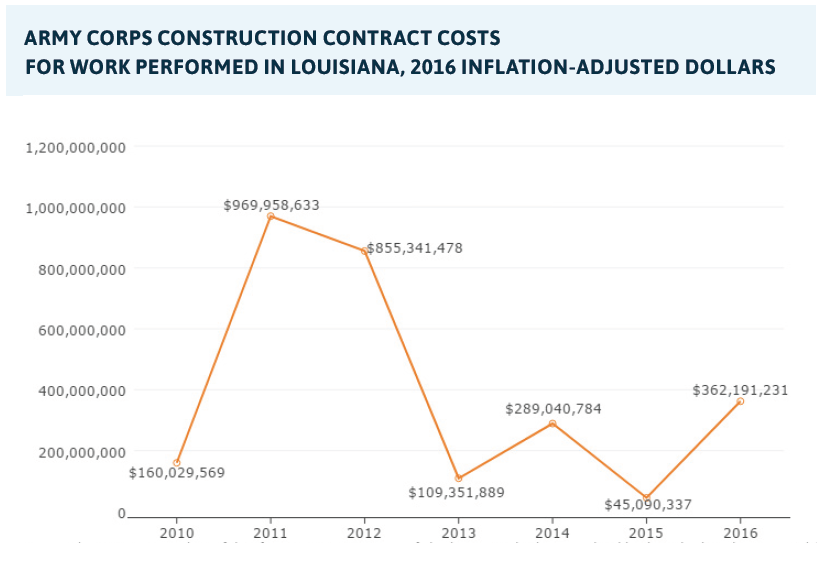
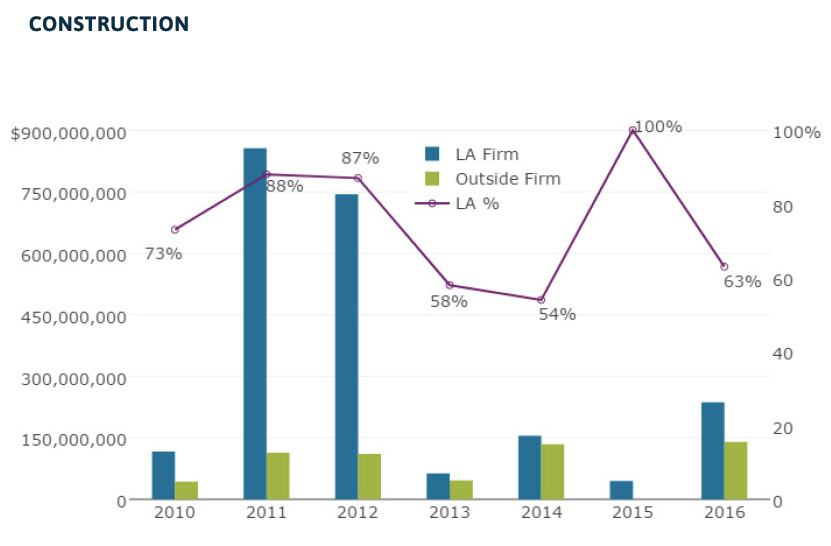
Since 2010, the Army Corps annually awarded approximately $27 million in services contracts, and $399 million in construction contracts. Construction is clearly the largest component of the Army Corps bucket.
While services contracts have averaged $27 million since 2010, they spiked to $52 million in 2016. Because of the size of Army Corps construction contracts, there is significant volatility in construction contract costs from year to year. In 2011 and 2012, Army Corps construction contracts to implement HSDRRS and SELA skyrocketed to nearly $1 billion per year. Construction contracts fell to $45 million by 2015 but rebounded to $362 million by 2016. Both HSDRRS and SELA were funded by a large one-time congressional appropriation. As work on these two projects winds down, this demand driver will likely diminish in importance to the water management cluster.[2]
Source: The Data Center analysis of data from USASPENDING.gov, a federal contracts database mandated by the Federal Funding Accountability and Transparency Act (FFATA) of 2006 and managed by the Office of Management and Budget (OMB).
Source: The Data Center analysis of data from USASPENDING.gov, a federal contracts database mandated by the Federal Funding Accountability and Transparency Act (FFATA) of 2006 and managed by the Office of Management and Budget (OMB).
-
WHAT IS THIS DEMAND DRIVER?
Mitigation banks are private companies (for-profit and nonprofit) that restore wetlands for the sale of future credits to companies and agencies that impact wetlands within the restoration watershed. Companies are required to mitigate wetland impacts before building under the Clean Water Act’s “no net loss” of water resources stipulation.[3] Credits vary in price and acreage, depending on geography, demand, and the method that the local Army Corps district uses to calculate impacts.
WHAT TYPE OF WORK DOES IT DO?
Mitigation banks work in various wetland environments including the coast, cypress-tupelo swamps, and pine flats.
WHAT TYPES OF WATER MANAGEMENT CONTRACTS DOES IT AWARD?
A restoration plan must be planned thoroughly, approved by the Army Corps, and its implementation must start before any credits are “released” by the Army Corps to the mitigation bank for sale. The planning work is sometimes contracted out and comparable to the types of regular services that the CPRA contracts out. The implementation of the mitigation bank project (e.g., the restoration and monitoring work) is comparable to CPRA construction work and monitoring work. Some mitigation companies contract out services and construction, while others have in-house capacity. Mitigation is permitted by the Army Corps, but restoration is not performed in alignment with goals and projects in the Master Plan.
WHAT DOES THE DATA SHOW?
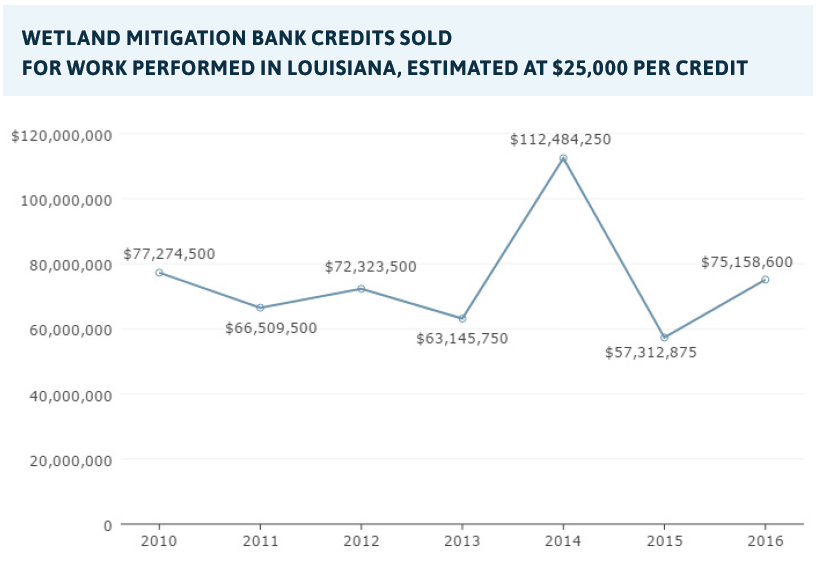
Since 2010, approximately $75,000,000 in mitigation bank credits have been sold, on average, each year in Louisiana. Mitigation banks represent a smaller but steadier demand driver than CPRA or the Army Corps.
Source: The Data Center analysis of data from RIBITS, an Army Corps database.
Notes: This data does not include any in-lieu fee program mitigation or permittee-responsible mitigation, which is mitigation done in an ad-hoc manner when sufficient or appropriate bank credits are not available in a given watershed.
Environmental Footprint
- Coastal Protection and Restoration Authority (CPRA)
- Mitigation Banks
-
WHAT DOES THE DATA SHOW?
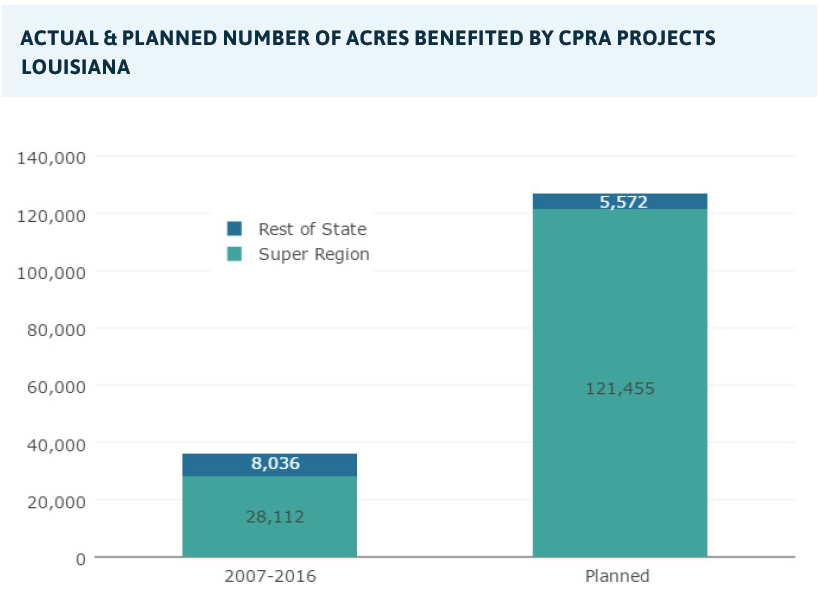
CPRA projects have benefited over 36,000 coastal acres since its inception in 2007. Over 75 percent of this beneficial environmental footprint has been within the Super Region. According to the Fiscal Year 2018 CPRA Annual Plan, projects resulting in the restoration and creation of 127,027 acres are funded for at least a portion of design or construction between 2018 and 2020; over 95 percent of those potential acres benefited are within the Super Region. Because the science behind these diversions has not been tested in the environment, the actual number of acres benefited will be important to monitor going forward.
Source: The Data Center analysis of data from Appendix A of the Fiscal Year 2018 CPRA Annual Plan.
Notes: Planned refers to projects funded for design or construction between 2018 and 2020 according to the CPRA FY 2018 Implementation Plan.
-
WHAT DOES THE DATA SHOW?
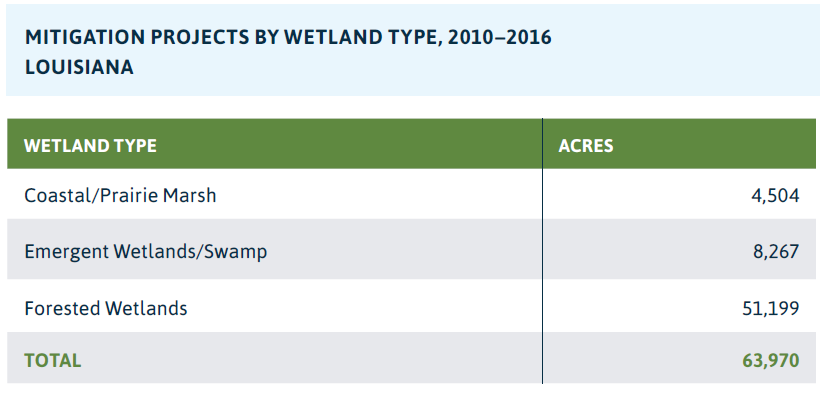
Mitigation banks have a large environmental footprint. Thousands of acres of wetlands have been initiated—or approved for restoration—by mitigation companies since 2010. As a bank begins mitigation work and meets compliance requirements, credits are released for sale. These credits can then be withdrawn, or sold, to meet compensatory mitigation requirements.[4] Total acres initiated, released, or withdrawn totals over 60,000 since 2010. Of note, coastal acreage is a small share of this total. This illuminates not only the relative expense of coastal restoration, but also the distinctions between water management projects of mitigation banks versus the CPRA.
Source: The Data Center analysis of data from RIBITS, an Army Corps database.
Economic Factors
- Industrial Structure
- Geographic Concentration
- Labor Force Quality
- Job Growth
- Wages
- Investment
- Research and Development
- Patents
- Export Potential
-
WHY IS THIS IMPORTANT?
Renowned University of Minnesota economist Ann Markusen identified three types of industrial districts. A “Marshallian” industrial district consists of many small, local firms that are tightly connected, such as the fashion industry in New York or brewers in Portland, Oregon. A hub-and-spoke district features large locally-headquartered firms closely connected to related producers and suppliers, such as Silicon Valley where HP and Sun Microsystems – and now Google, Intel, and Apple – are hubs of the computer universe, supporting a host of spin-offs and supportive companies. Lastly, a satellite platform district consists of branch plant operations of major companies headquartered elsewhere.[5] A perfect example is the bio-pharmaceutical cluster in the Research Triangle. The Research Triangle consists of the R&D arms of many international companies that have little interaction with one another and that cluster in a wide geography in North Carolina. There is potential in each of the structures. The industrial district and hub-and-spoke offer the potential for a specialized local workforce and local growth, while the satellite platform offers the potential for in-migration of a specialized workforce and innovation spillovers that form new start-ups and industries.[6,7]
WHAT DOES THE DATA SHOW?
Available data from two of the largest demand drivers, The Army Corps and the CPRA, suggests that the water management cluster is currently a hybrid between two types of industrial structures: the hub-and-spoke and the satellite platform districts. Because water management contracts tend to be upwards of $3 million, winners of prime contracts tend to be large local companies or branches of large companies from outside. The large local firms are more likely to be construction firms; and when larger services firms are used, they tend to be companies headquartered outside of Louisiana. These primes, regardless of location, then usually subcontract out to an array of small, mostly local firms.
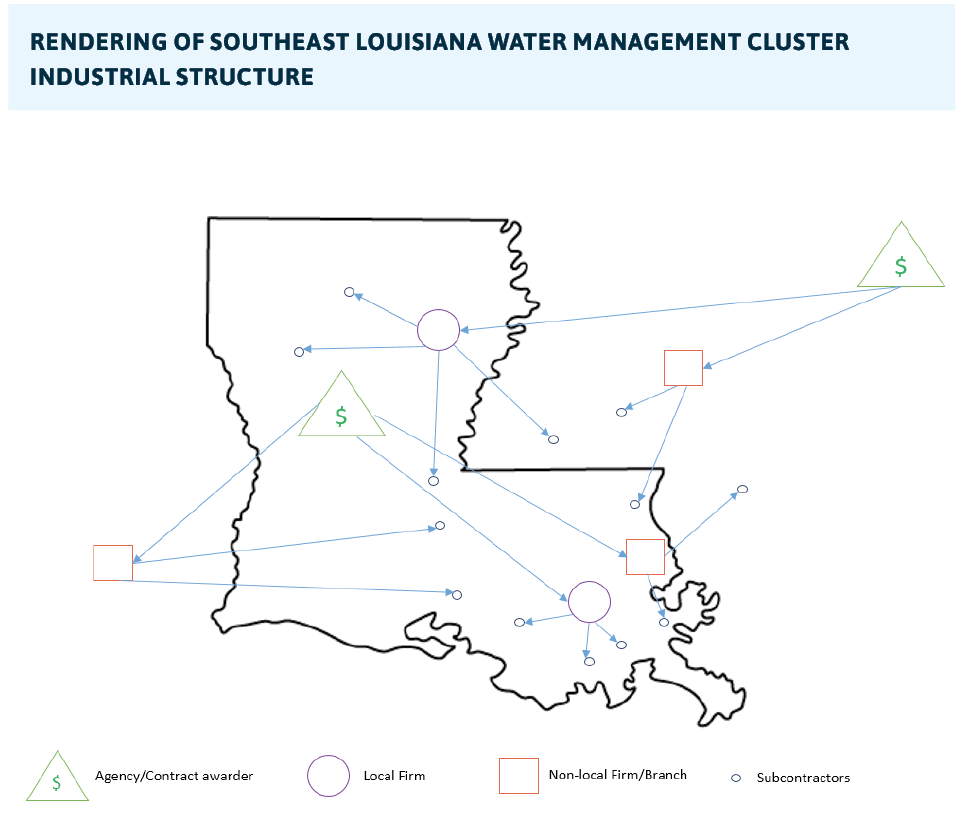
Note: This graphic is not a literal representation of Louisiana or firm locations.
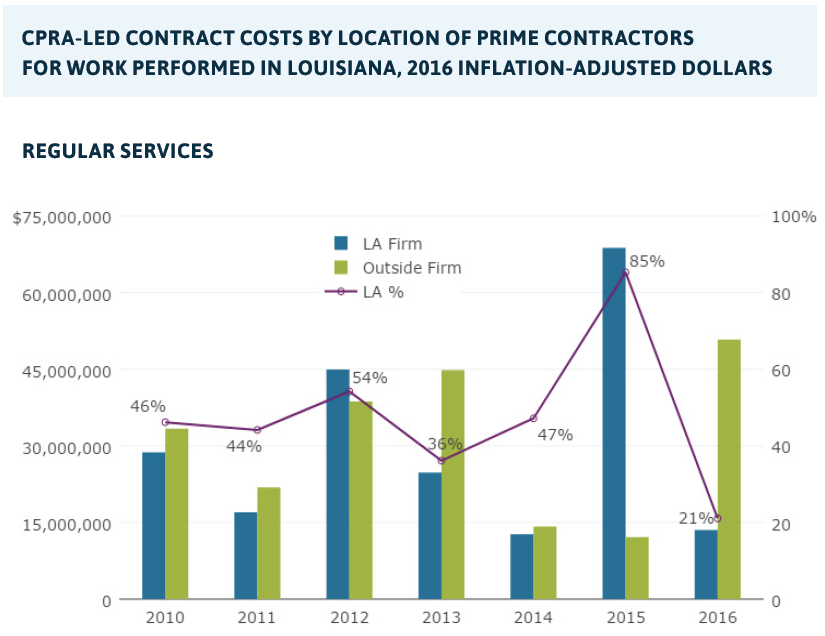
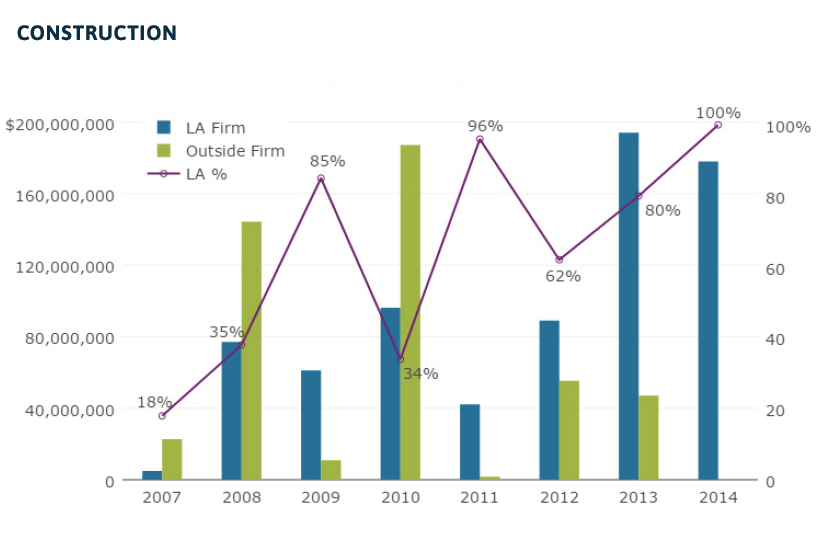
Among prime contractors, Louisiana firms were more likely to win Army Corps contracts than CPRA contracts. From 2010 to 2016, Louisiana firms received 83 percent of Army Corps services contract dollars and 79 percent of Army Corps construction contract dollars. Indeed Louisiana firms win a disproportionately large share of Army Corps contracts in Louisiana. Louisiana firms won only 49 percent of CPRA regular services contract dollars from 2010 to 2016 and 61 percent of CPRA construction contract dollars from 2007 to 2014.
Source: The Data Center analysis of data gathered from CPRA IDIQ services contracts and LaTrac.
Notes: Location of firm was determined by corporate headquarters.
Notes: Percentages are based upon share of contract dollars as opposed to number of contracts.
Source: The Data Center analysis of data gathered from CPRA completion reports,cash transfer data gathered by GNO Inc., and internal CPRA project data.
Notes: Location of firm was determined by corporate headquarters.
Notes: Percentages are based upon share of contract dollars as opposed to number of contracts.
Notably, Louisiana firms have won a larger share of CPRA contract dollars in recent years. In 2013, Louisiana firms won 80 percent, and in 2014 they won 100 percent of CPRA construction contracts. In 2015, Louisiana firms won 85 percent of CPRA regular services contract dollars, but only 21 percent in 2016. Currently CPRA is constrained to awarding construction contracts to the lowest bidder. Changes to this and other policies and practices could help to boost the share of CPRA dollars that consistently go to Louisiana firms.

Source: The Data Center analysis of data from USASPENDING.gov, a federal contracts database mandated by the Federal Funding Accountability and Transparency Act (FFATA) of 2006 and managed by the Office of Management and Budget (OMB).
Notes: Location of headquarter of firm was specified in the USASPENDING.gov data.
Notes: Percentages are based upon share of contract dollars as opposed to number of contracts.
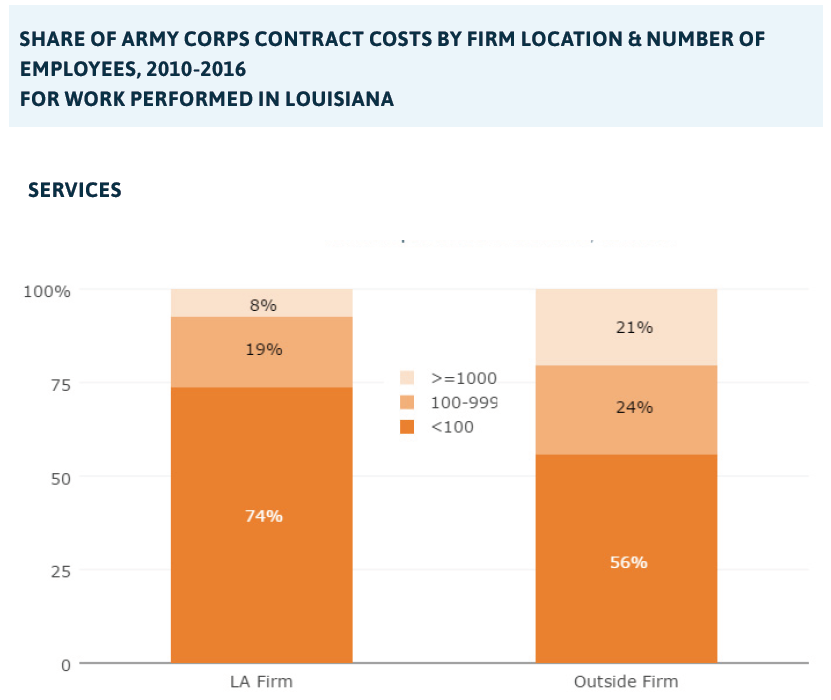
Louisiana firms that secured Army Corps services contracts were more likely to be small (less than 100 employees), while Louisiana firms that secured construction contracts were more likely to be large (1,000 or more employees).
Source: The Data Center analysis of data from USASPENDING.gov, a federal contracts database mandated by the Federal Funding Accountability and Transparency Act (FFATA) of 2006 and managed by the Office of Management and Budget (OMB).
Notes: Location of headquarter of firm was specified in the USASPENDING.gov data.
Notes: Percentages are based upon share of contract dollars as opposed to number of contracts.
A detailed analysis of CPRA regular services contracts reveals that Louisiana firms are less likely to receive contracts for engineering services, environmental science consulting, and geotechnical services, but they are more likely to win contracts for surveying and professional land services. Professional land and surveying contracts require land service and survey professionals to be licensed in Louisiana. Engineering and geotechnical contracts also require engineers of all disciplines to obtain licenses in Louisiana. This suggests that LA licensing is not the driving force behind local firms winning contracts as some might suspect.
Source: The Data Center analysis of data gathered from CPRA IDIQ services contracts and LaTrac.
Notes: Location of firm was determined by corporate headquarters.
Notes: Percentages are based upon share of contract dollars as opposed to number of contracts.
Data gathered on CPRA regular services prime and subcontractors revealed that, on average, each prime included 5.6 subcontractors in their proposals . The subs proposed were mostly local—66 percent were either Louisiana firms or had a majority of employees on the project domiciled in Louisiana. However, there is no data to confirm that these subcontractors actually were utilized on the proposed work when it was finally executed.
Source: The Data Center analysis of data gathered from CPRA IDIQ services contracts.
-
WHY IS THIS IMPORTANT?
There are economic advantages to tight geographic clustering of related businesses. Geographic concentration not only saves on transportation costs, but it also increases the ability to solve problems as well as promotes healthy competition and collaboration that, in turn, spur innovation.[8,9]
WHAT DOES THE DATA SHOW?
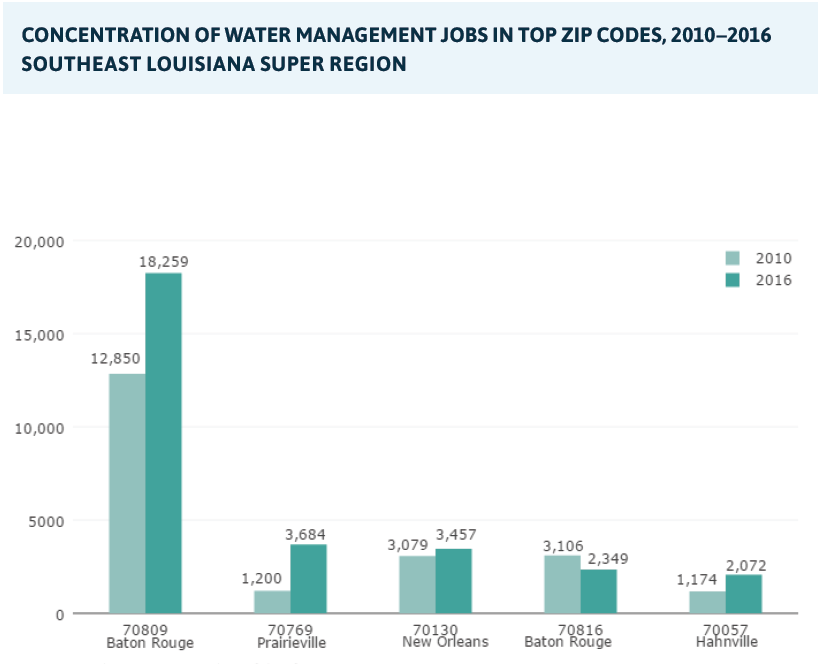
The Super Region has a high concentration of water management jobs within its top ZIP code relative to comparison metros. A full 25 percent of water management jobs are located within just the top ZIP code, and 41 percent of water management jobs in the Super Region are within the top five ZIP codes. However, the top five ZIP codes are spread across the Baton Rouge and New Orleans metros. Thus, easy transportation is imperative to preventing fragmentation. The Water Campus in Baton Rouge is a nice step toward creating an environment in which different verticals, suppliers, startups, institutions, and governmental bodies can support a growing and innovating cluster, particularly if the headquarters or branch plant operations of environmental, engineering, and construction firms decide to invest there. But, leaders will need to commit to long-term strategies that efficiently move workers around the Super Region to achieve a critical mass of interconnected firms and institutions.
Source: The Data Center analysis of data from EMSI.
Notes: Data based on EMSI pull of LED and BLS data from Q4, 2016.
Source: The Data Center analysis of data from EMSI.
Notes: Data based on EMSI pull of LED and BLS data from Q4, 2016.
Notes: Prairieville is located in the Baton Rouge metro, and Hahnville is located in the New Orleans metro.
-
WHY IS THIS IMPORTANT?
Human capital is now the best predictor of regional economic growth. Research has shown that educated cities are growing faster, oftentimes despite lack of amenities.[10] In addition, labor is more mobile than ever; and high-quality labor flocks to places that have high-quality labor.[11] The prevalence of adults with a college degree is the most meaningful indicator of an educated workforce. In addition, the share of the population 18-24 years old with a bachelor’s degree in science and engineering is a tidy in-time snapshot that measures the upcoming water management workforce.[12,13]
WHAT DOES THE DATA SHOW?
The Super Region is behind the nation and comparison metros on two important measures of educational attainment. In the Super Region, only 55 percent of adults 25 years and older have at least some college education compared to 63 percent in comparison metros as of 2015. In addition, just 27 percent of Super Region adults have a bachelor’s degree or higher, compared to 33 percent in comparison metros.
Source: U.S. Census Bureau, Decennial Census & 2015 American Community Survey.
Another important measure of educational attainment shows Louisiana losing ground to the nation. Although Louisiana’s share of science, engineering, and technology (SET) graduates increased from 13 per 1,000 young adults in 2008 to 14.3 in 2013, nationwide SET graduates grew much more rapidly from 16.8 to 19.9 per 1,000 young adults ages 18 to 24 over the same time frame.
Source: National Science Foundation analysis of data from IPEDS.
-
WHY IS THIS IMPORTANT?
Job growth is an indicator commonly used to assess the pace of economic growth in a metro or region. Job growth also gauges Southeast Louisiana’s water management cluster against possible competitors.
WHAT DOES THE DATA SHOW?
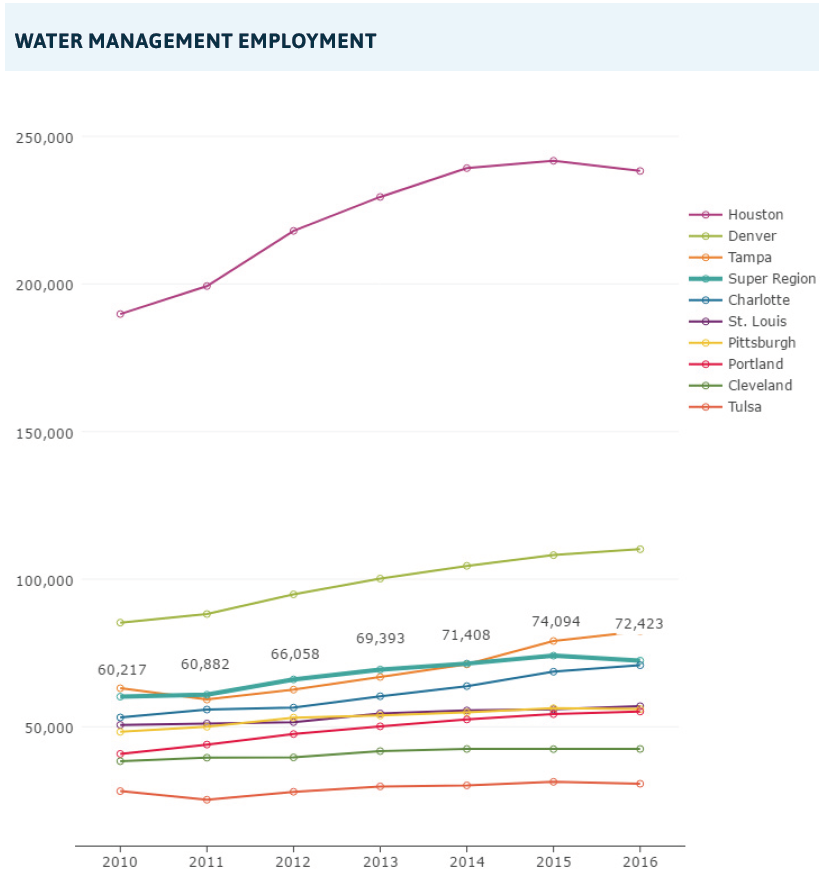
Water management jobs in the Super Region grew from 60,217 in 2010 to 74,094 in 2015, but slipped to 72,423 in 2016. While behind Houston, Denver, and Tampa, the Super Region is ahead of Charlotte, St. Louis, Pittsburgh, Portland, Cleveland, and Tulsa in total water management jobs as of 2016.
Source: The Data Center analysis of data from EMSI and U.S. Cluster Mapping Project.
-
WHY IS THIS IMPORTANT?
Good wages, especially within a sector, are necessary for attracting and keeping a quality workforce. In fact, healthy clusters, and the competition and innovation they foster, are often catalysts for higher wages within that cluster. Increasing wages, therefore, are often an indicator of a thriving cluster.[14]
WHAT DOES THE DATA SHOW?
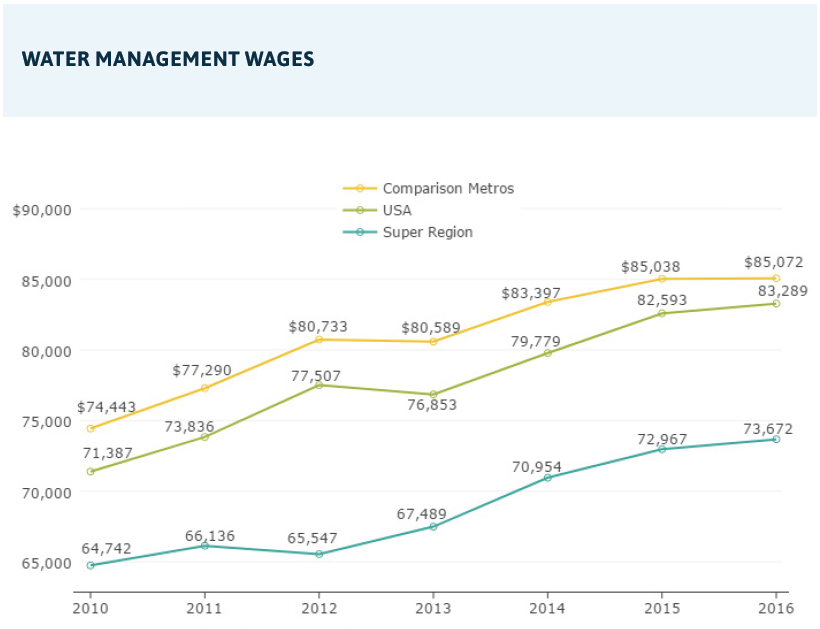
As of 2016, Super Region jobs in the water management cluster pay $11,400 less per year than in comparison metros. But, this gap has declined since 2012 when it was roughly $15,000. Water management wages in the Super Region have increased 12 percent since 2012 while water management wages in comparison metros have increased only 5 percent on average.
Source: The Data Center analysis of data from EMSI and U.S. Cluster Mapping Project.
Notes: Wages refer to average wages, salaries, and proprietor earnings. They do not include benefits, supplements, or similar non-salary additions.
-
WHY IS THIS IMPORTANT?
Research has shown that venture capital co-locates with the formation of new industries. Many metros believe they have the potential to become major commercial hubs just based on the presence of a large research institution or corporation. But, investment dollars are a necessary piece of the puzzle. Venture capital works in conjunction with these place-based assets—and often with a culture of risk—to produce an ecosystem where new technologies and spin-offs emerge from local companies and satellite offices alike. Places with low stocks of venture capital are unlikely to be sites of new innovation and healthy cluster development.[15,16]
WHAT DOES THE DATA SHOW?
Data provided by PitchBook for each of the major cities in the Super Region suggests that New Orleans based companies have benefited from accelerating levels of seed funding —from completed deals of $160,000 in 2011 to completed deals of $1,990,000 in 2015. Baton Rouge had $1,250,000 in completed seed deals in 2012 but less seed funding in subsequent years. New Orleans has also experienced notable growth in completed angel deals, reaching $6,305,000 by 2015, while Baton Rouge had $10,864,240 in 2011 and very little angel funding in subsequent years. New Orleans has the highest levels of venture capital completed deals from $22,060,000 in 2010 to $9,162,900 in 2015. Baton Rouge had $8,905,600 in venture capital completed deals in 2010 and less venture capital from 2011 to 2015. Houma is lacking in investment across all stages of investment. This data suggests that New Orleans has the greatest level of funding available to support innovation and commercialization of research that might emerge from universities and other research centers.
Source: Investment funding data from PitchBook.
Notes: Location refers to the location of the company receiving investment, not the location of the investor.
Source: Investment funding data from PitchBook.
Notes: Location refers to the location of the company receiving investment, not the location of the investor.
Source: Investment funding data from PitchBook.
Notes: Location refers to the location of the company receiving investment, not the location of the investor.
-
WHY IS THIS IMPORTANT?
Spillover from R&D, whether it be in business, academia, or government, has spawned many famous clusters.[17] Investments in and the commercialization of innovation are essential for the emergence of a cluster.[18]
WHAT DOES THE DATA SHOW?
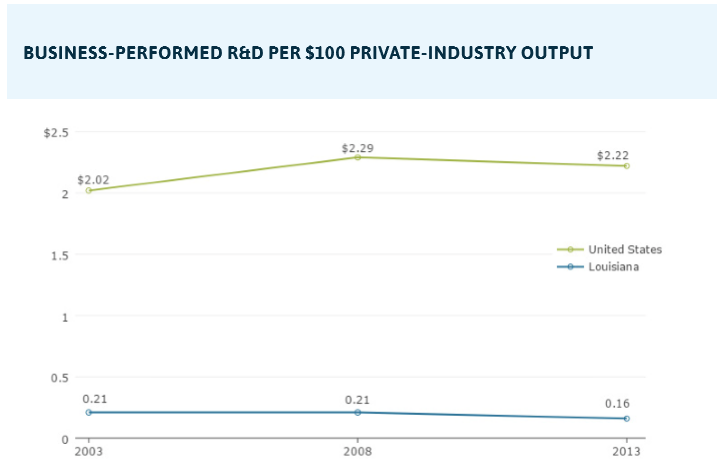
Louisiana has less R&D than the nation across four major categories: academic science and engineering, business-performed R&D, federal R&D obligations, and state agency R&D. Most notably, academic science and engineering R&D investments have fallen from near the national average in 2003 ($3.26 per $1,000 GDP) to $2.56 in 2013. However, state agency R&D per $1 million GDP has increased from $31 in 2007 to $64 in 2013, likely a reflection of the state’s increased investments in the Water Institute of the Gulf.
Source: The National Science Foundation analysis of data from NCSES and the BEA.
Notes: Academic R&D is reported for institutions with over $150,000 in R&D.
Source: The National Science Foundation analysis of data from the Census Bureau Business R&D and Innovation Survey and BEA.
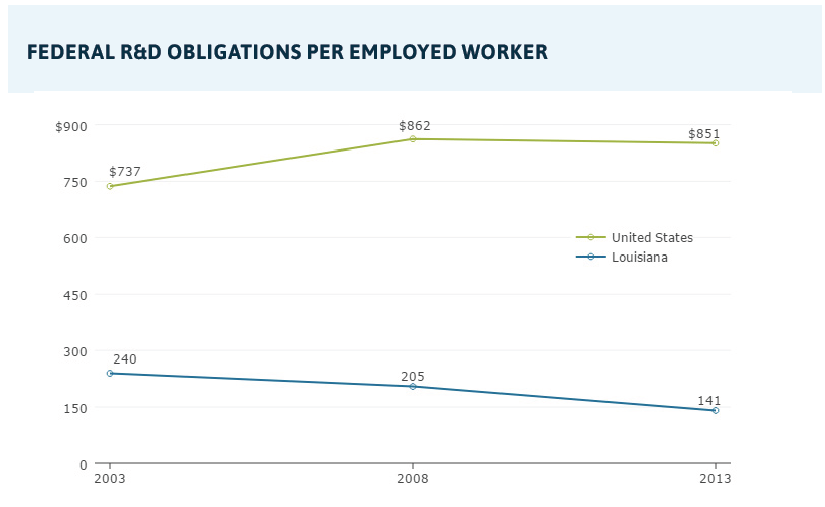
Source: The National Science Foundation analysis of data from NCSES and BLS.
Notes: Only 11 institutions are required to report Federal R&D obligations, which represent over 98% of Federal R&D.
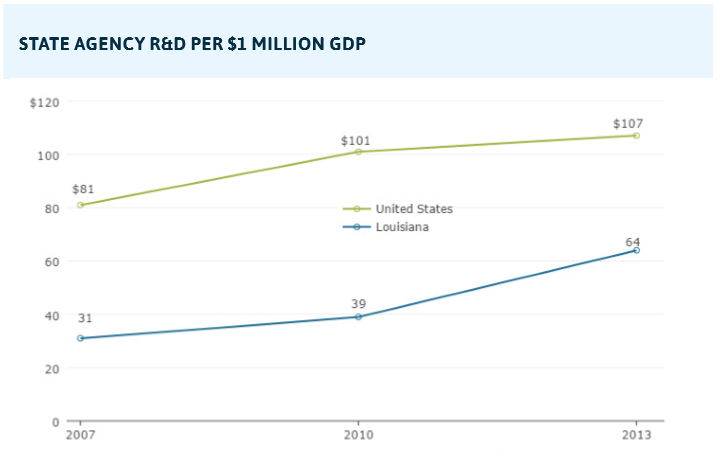
Source: The National Science Foundation analysis of data from NCSES Survey of State Research and Development Expenditures and BEA.
-
WHY IS THIS IMPORTANT?
Innovation involves putting new ideas into commercial use, including the creation of new products or services (“product innovation”), the use of new production technologies and techniques (“process innovation”), and the implementation of new ways to organize work and business processes (“organizational innovation”).[19] Though innovation is notoriously difficult to measure, the number of patents granted is often used as an indicator of innovation, because it specifically indicates the level at which people are seeking and securing intellectual property protection for their innovative ideas. This indicator measures the number of patents granted per million residents in the year the patent application was filed.
WHAT DOES THE DATA SHOW?
When looking at the patent applications filed from 2007 to 2011 across comparison metros, the number of patents granted per million residents was the lowest in the Super Region at only 81. At the high end, Portland had more than ten times the level of patent applications as the Super Region, and at the low end, Tulsa had nearly double the level of patent applications as the Super Region. The top subclass of patents granted in the Super Region was chemical compounds and compositions. Both Houston and Tulsa’s top subclass of patents granted were in earth working and wells. Houston’s level of patents granted was more than quadruple the Super Region’s even when factoring in Houston’s much larger population.
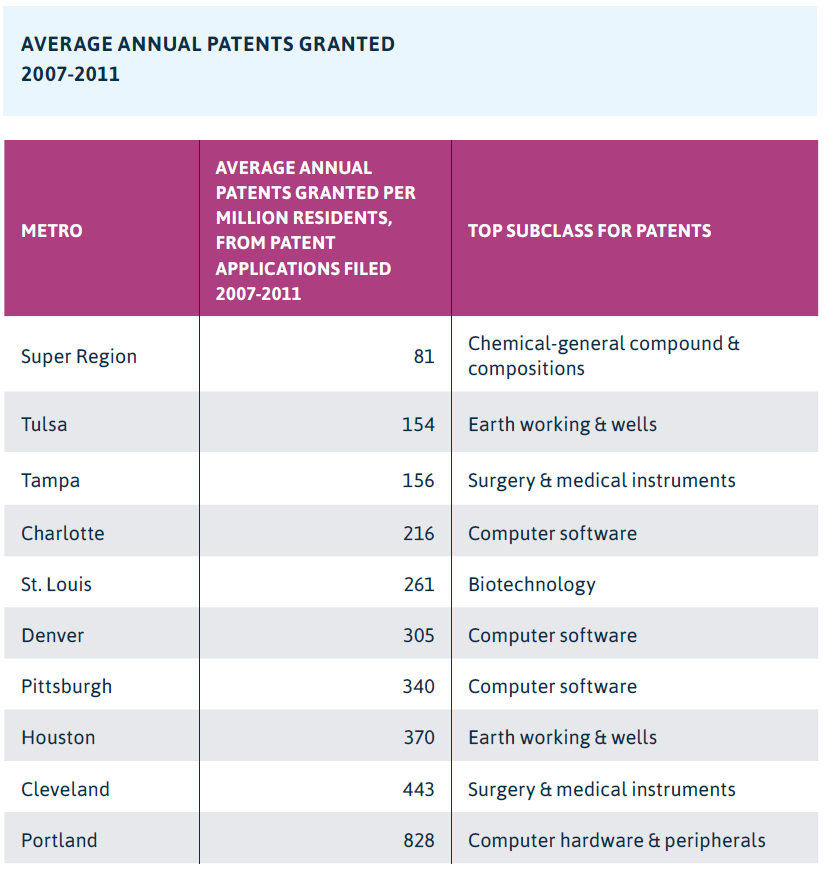
Source: The Data Center analysis of data from Brookings and U.S. Decennial Census.
-
WHY IS THIS IMPORTANT?
All regional economies generate wealth from the production and sale of goods and services. Products are either sold to the local population or “exported” for sale to customers outside the region. It is the export of products and services to other regions that chiefly drives regional growth and development. Export industries generate income from outside the region, supporting additional jobs in supplier industries as well as industries that serve local consumption needs.[20]
WHAT DOES THE DATA SHOW?
Available data on Army Corps expenditures nationwide reveals a sizable export market for Louisiana’s water management companies. From 2010 to 2016, the Army Corps gave out an annual average of $1.3 billion to do work outside Louisiana but within the United States. The amount the Army Corps spent outside Louisiana spiked to $4.3 billion in 2016.
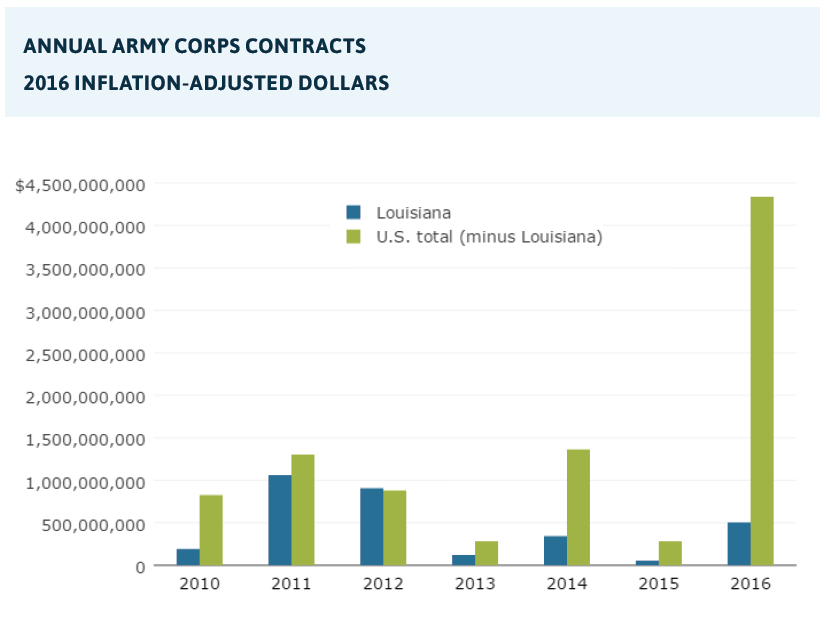
Source: The Data Center analysis of data from USASPENDING.gov, a federal contracts database mandated by the Federal Funding Accountability and Transparency Act (FFATA) of 2006 and managed by the Office of Management and Budget (OMB).
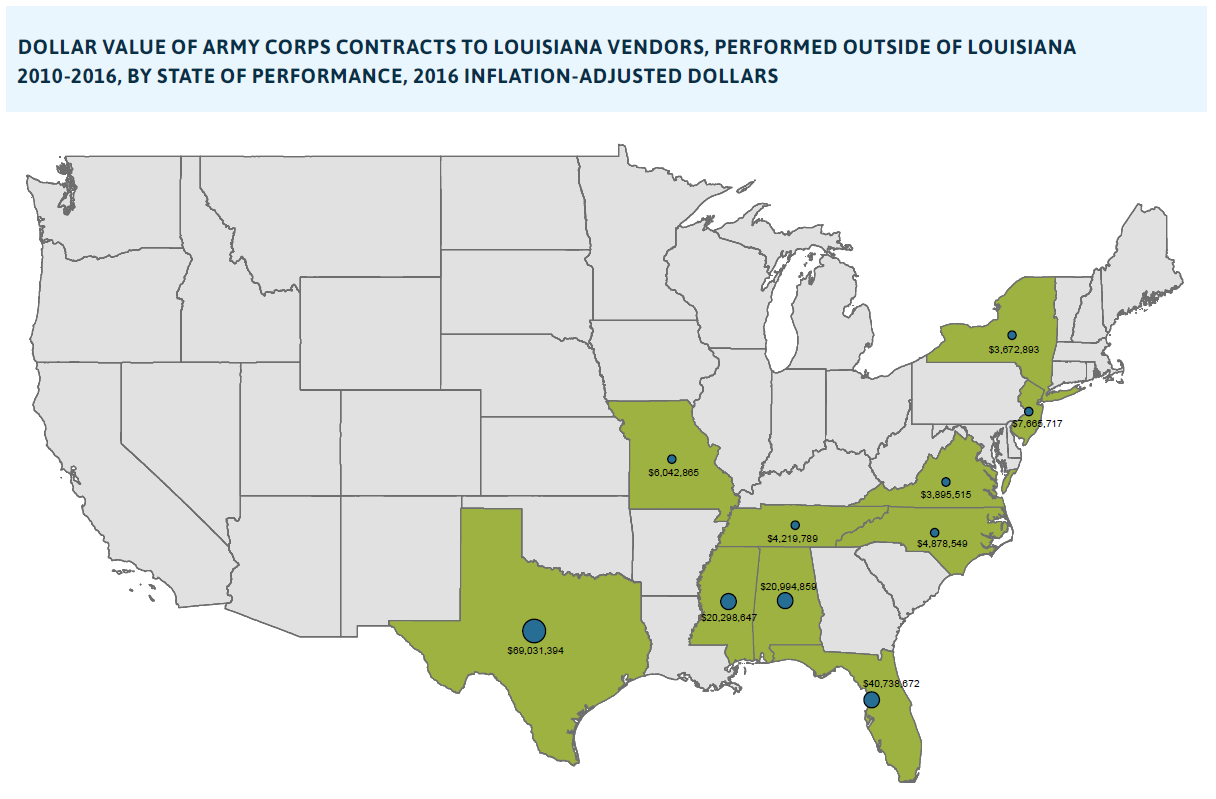
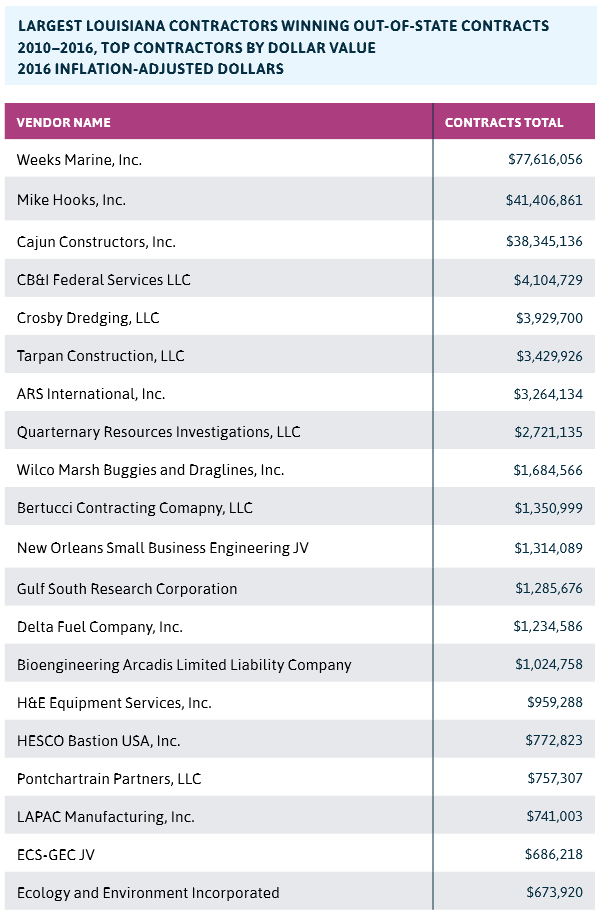
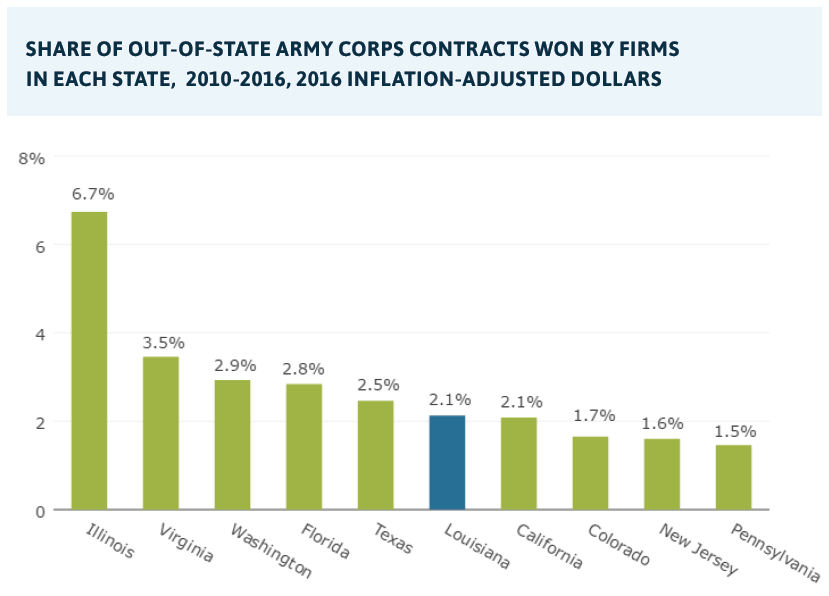
Louisiana companies are winning Army Corps contracts for work outside Louisiana, surging to over $124 million in 2016. The states where Louisiana companies secured more than $20 million in contracts from 2010 to 2016 were Texas, Florida, Alabama, and Mississippi. Large local construction firms, including Weeks Marine, Mike Hooks, and Cajun Constructors have all secured more than $35 million in out-of-state Army Corps contracts since 2010.
Source: The Data Center analysis of data from USASPENDING.gov, a federal contracts database mandated by the Federal Funding Accountability and Transparency Act (FFATA) of 2006 and managed by the Office of Management and Budget (OMB).
Notes: This data represents contracts funded by the Army Corps and includes exclusively civil program financing.
Source: The Data Center analysis of data from USASPENDING.gov, a federal contracts database mandated by the Federal Funding Accountability and Transparency Act (FFATA) of 2006 and managed by the Office of Management and Budget (OMB).
Source: The Data Center analysis of data from USASPENDING.gov, a federal contracts database mandated by the Federal Funding Accountability and Transparency Act (FFATA) of 2006 and managed by the Office of Management and Budget (OMB).
Notes: Some highlighted Louisiana firms have since moved or been purchased by firms headquartered elsewhere (e.g. Weeks Marine).
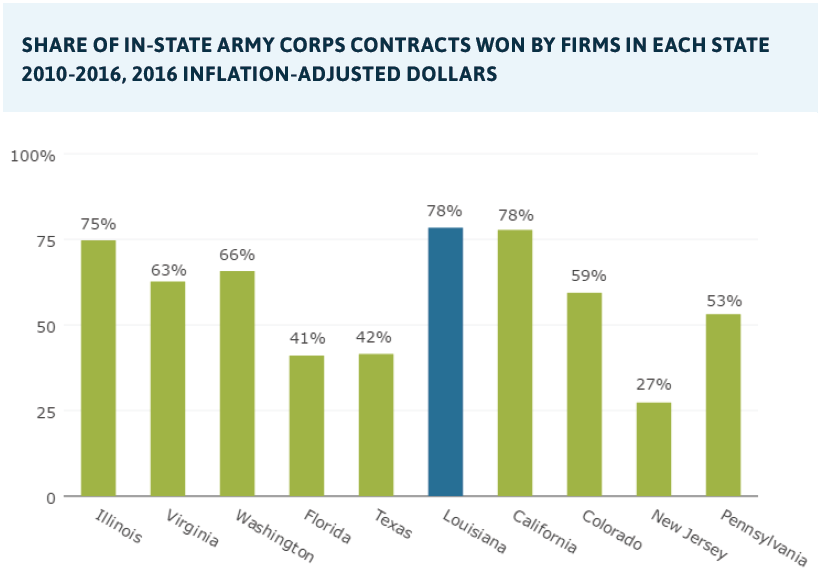
Louisiana’s firms win more total Army Corps contract dollars than firms in any other state, particularly because of the tremendous size of projects within Louisiana, but also because Louisiana firms win a disproportionately large share of the contracts in Louisiana (78 percent as compared to the average of 39 percent for all states). A few other states win a higher share of out-of-state contract dollars, but Louisiana firms have been expanding their share of out-of-state Army Corps contracts and now rank 6th among all states for receiving out-of-state Army Corps contracts.
Source: The Data Center analysis of data from USASPENDING.gov, a federal contracts database mandated by the Federal Funding Accountability and Transparency Act (FFATA) of 2006 and managed by the Office of Management and Budget (OMB).
Source: The Data Center analysis of data from USASPENDING.gov, a federal contracts database mandated by the Federal Funding Accountability and Transparency Act (FFATA) of 2006 and managed by the Office of Management and Budget (OMB).
Notes: Out-of-state contract total pot is total available contract dollars outside of the relevant state’s pot.
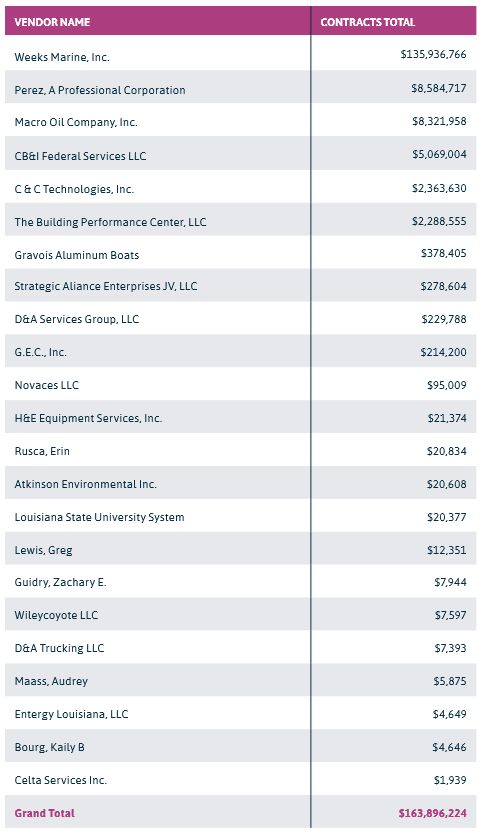
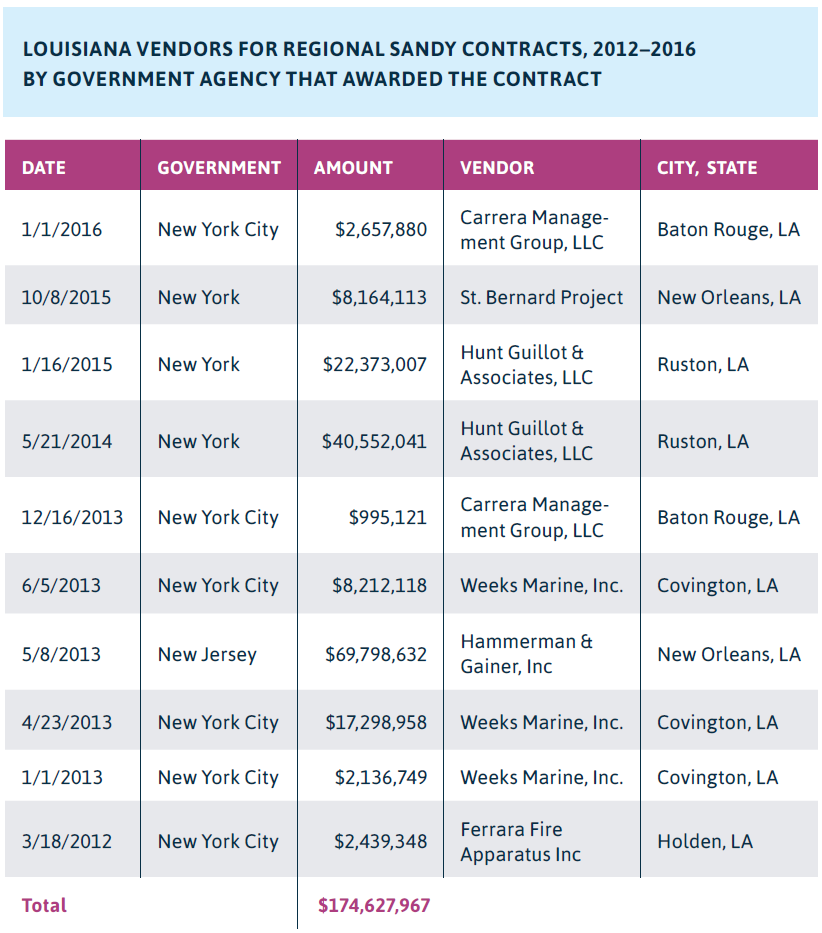
Hurricane Sandy contracts indicate whether Louisiana water management firms were being consulted on disaster management and for construction and services associated with Sandy’s aftermath. At the federal level, Louisiana companies won contracts in multiple Atlantic seaboard states, totaling approximately $163 million across federal agencies (from the U.S. Fish and Wild Life Service to FEMA) from 2012 to 2016. Louisiana firms also secured approximately $175 million in Sandy contracts from the State of New York, State of New Jersey, and New York City. Data was not gathered for agencies outside of these regional scopes.

Source: The Data Center analysis of data from USASPENDING.gov, a federal contracts database mandated by the Federal Funding Accountability and Transparency Act (FFATA) of 2006 and managed by the Office of Management and Budget (OMB).
Notes: Some highlighted Louisiana firms have since moved or been purchased by firms headquartered elsewhere (e.g. Weeks Marine).
Source: The Data Center analysis of data from New York Rising, New Jersey Hurricane Sandy Office of Transparency, and the New York City Sandy Funding Tracker.
Notes: Some highlighted Louisiana firms have since moved or been purchased by firms headquartered elsewhere (e.g. Weeks Marine)
Social Factors
- Philanthropic Support
- Social Capital
- Social Leadership
-
WHY IS THIS IMPORTANT?
Philanthropic support is an indicator of corporate and civic priorities. It identifies what the leaders within a community find valuable and how they dedicate their resources. The extent to which Super Region foundations contribute to environmental causes is an indicator of the footprint of corporate environmental responsibility. Philanthropy has an impact on crucial inputs for economic development, such as workforce development and information sharing.
WHAT DOES THE DATA SHOW?
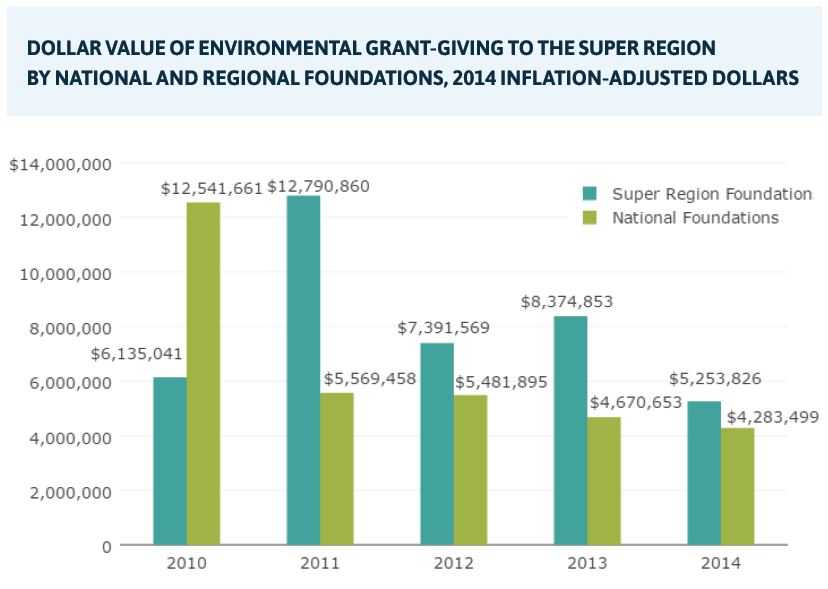
There was a decline in national foundation giving to environmental causes within the Super Region from 2010 to 2014 from more than $12 million to $4 million. Regional foundations more than doubled their giving to environmental causes within the Super Region from $6 million in 2010 to more than $12 million in 2011, but that giving had fallen back to $5 million by 2014. Because national foundations give regional foundations grants to then re-grant to local nonprofits, the rise in Super Region grant-giving in 2011 may be largely accounted for by the transference of grants from national foundations in 2010.[21]
Source: The Data Center analysis of data from the Foundation Center.
Notes: Environmental is defined as all grants that fall under the subject group “environment.” Grant subjects are determined by self-reported subjects in most cases and Foundation Center assigned subjects in some cases.
The largest share of grant-giving by Super Region foundations has gone to human services and education in recent years. While grant-giving to human services averaged $14 per capita from 2012 to 2014, and grant-giving to education averaged $11.13 per capita during the same time, grant-giving to environmental organizations has fallen from $3.05 per capita in 2012 to $2.13 per capita in 2014.
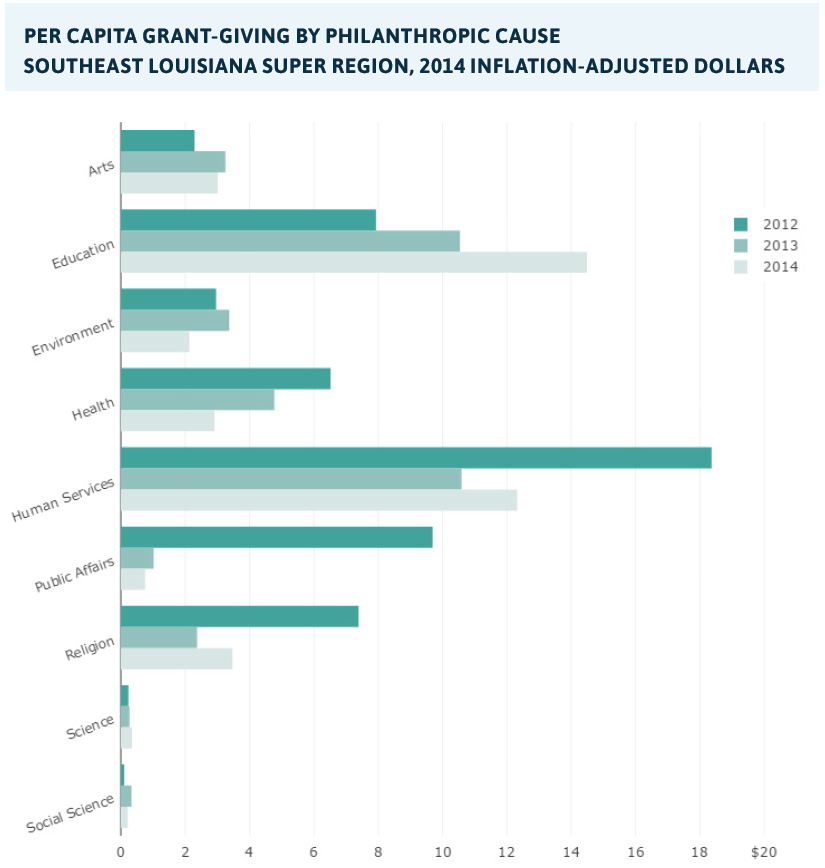
Source: The Data Center analysis of data from the Foundation Center and the U.S. Census Bureau 2016 Population Estimates.
Notes: Philanthropic causes correspond to Foundation Center subject groups. Grant-giving that does not fall into these groups is not shown.
-
WHY IS THIS IMPORTANT?
Social organizations have historically played a powerful role in the formation and growth of clusters. A classic case is Silicon Valley, where formal and informal networks between businesses and workers in the computer industry fueled information exchange, idea sharing, skills development, productivity, and competition. In order for environmental industries and issues to have a voice, there also needs to be a strong civic infrastructure. That infrastructure comes from social organizations and their budgets.
WHAT DOES THE DATA SHOW?
There are 86 formal environmental organizations within the Super Region. Combined annual revenues for these organizations, at approximately $55 million, are low. In contrast, environmental organizations in the Portland metro—which is comparable in jobs and population to the Super Region—have $372 million in combined revenue. The Super Region’s lack of capital for environmental organizations likely means less exchange of ideas and homebrew-style innovation, as well as weaker political and civic clout for environmental causes than in comparison metros.
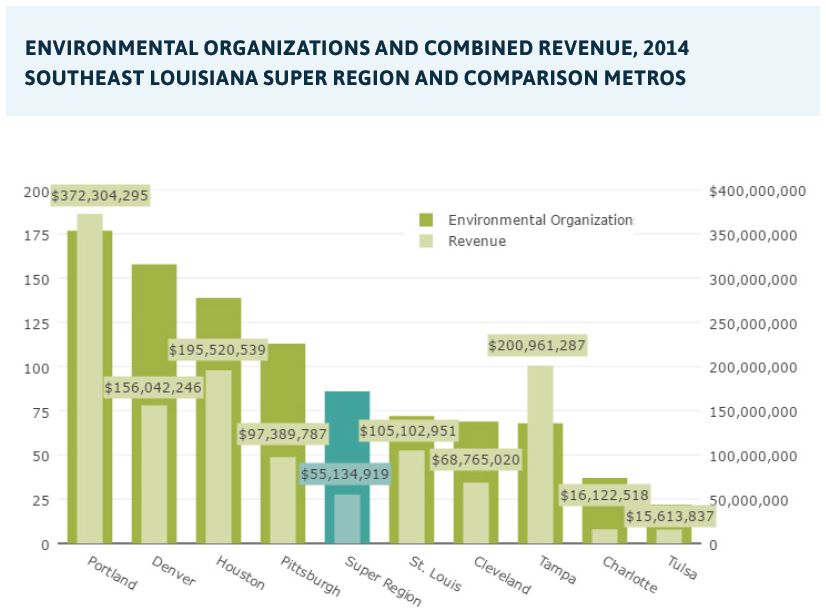
Source: The Data Center analysis of data from NCCS, an Urban Institute database of IRS 990 forms and metadata.
Notes: Numbers refer to interior boxes.
Notes: The environmental sector is defined by NTEE subject codes.
-
WHY IS THIS IMPORTANT?
How organizations are connected matters for economic development. For example, the “homebrew” clubs of Silicon Valley brought together multiple organizations and had a heterogeneous membership. This meant that they had new ideas entering into the organizational space. In contrast, the same benefits are not accrued when membership is homogenous. And in the inverse scenario, when organizations have no overlap with each other, non-collaborative silos form. Organizations that create bridging networks (i.e., networks that put people in contact who would not otherwise be in contact) lead to a healthier mix of ideas and resources that can be deployed for planning and economic development. A heterogeneous board of directors (with some board members “overlapping” with other organizations within the same sector and in different sectors) is important for environmental organizations to ensure a healthy mix of ideas. Minimal board overlap indicates fragmented ties between sectors, while excessive overlap indicates homogeneity.[22]
WHAT DOES THE DATA SHOW?
The most recent data shows that environmental organizations have only 1.6 percent board overlap with each other. Insufficient overlap among environmental boards risks turf wars for funding and power. In addition, environmental organizations have no substantial overlap with other areas of the nonprofit sphere. Connecting environmental organizations more closely to economic development organizations, philanthropic organizations, educational institutions, and employment organizations can lead to broader influence and support for the water management cluster.
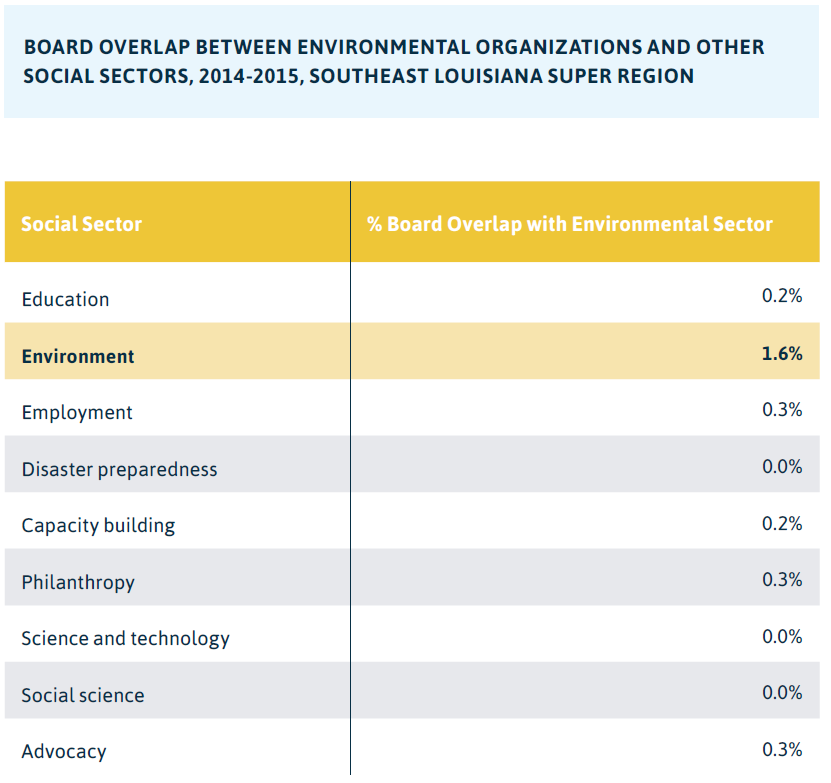
Source: The Data Center analysis of data from NCCS, an Urban Institute database of IRS 990 forms and metadata.
Notes: Sectors are defined by NTEE subject codes.
Notes: Latest 990 forms were pulled in February, 2017. Most were from 2015 and 2014, some 2013.
Political Support
- Public Funding
- State Funding for Higher Education
-
WHY IS THIS IMPORTANT
Large infusions of public money have been key catalysts of some of the most well-known clusters nationwide. The Midwest manufacturing belt was spurred by WWII spending, and Silicon Valley is what it is today because of military support for radio technology. In addition, Boston’s biotech cluster continues to depend on NIH grants, and the success of the Research Triangle, as a technology and bio-pharmaceutical cluster, was heavily influenced by state funding and policies.[23]
WHAT DOES THE DATA SHOW?
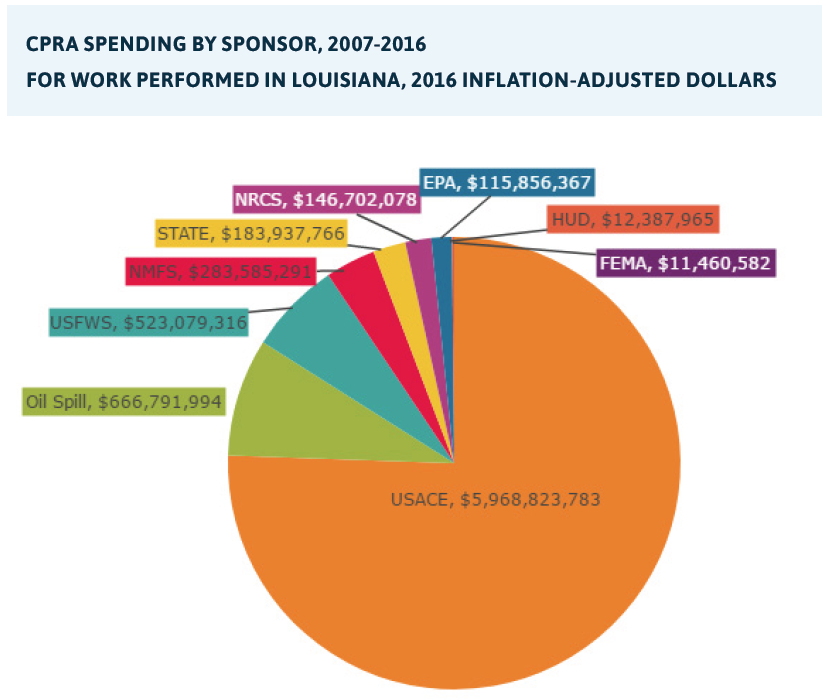
CPRA official publications tout that $50 billion will be spent on coastal protection and restoration over the next 50 years. To be sure, nearly $8 billion was spent from 2007 to 2016 by the CPRA and partner agencies, such as the Army Corps and local levee boards. This represents some $800 million of collaborative coastal program spending on average each year.
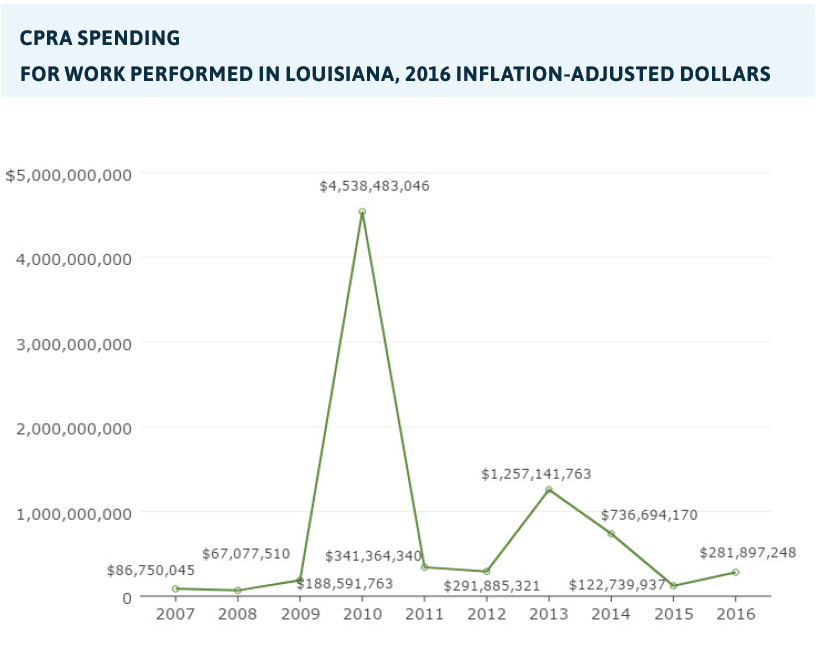
Source: Coastal Protection and Restoration Authority, “Fiscal Year 2018 Annual Plan, Appendix A.”
Notes:This spending includes contracts as well as administrative and operating expenses.
A breakdown by program and sponsor reveals fully 98 percent of the reported spending from 2007 to 2016 was sponsored by various federal programs. Indeed, 75 percent of CPRA spending from 2007 to 2016 was for the New Orleans Hurricane Protection System (HSDRRS), primarily funded by the Army Corps. A small two percent came from state coffers, although it is worth noting that unaccounted for dollars were spent in matching funds for CIAP and CDBG program projects. Notably, Louisiana is on the hook for about $100 million annually for the HSDRRS system, which is required to be paid over 30 years beginning in 2019.[24]
Source: Coastal Protection and Restoration Authority, “Fiscal Year 2018 Annual Plan, Appendix A.”
Notes:This spending includes contracts as well as administrative and operating expenses.
-
WHY IS THIS IMPORTANT?
States have historically been the primary force behind funding public higher education.[25] Research has shown that labor flocks to places that have high-quality labor, and educated cities grow faster, oftentimes, despite lack of amenities.[26] For example, in the 1950s, the state of North Carolina built the Research Triangle Park—first envisioned as a way to strategically invest the meager resources of a poor state. North Carolina invested heavily in higher education, which attracted federal research institutions, and R&D divisions of large companies, such as IBM.[27]
WHAT DOES THE DATA SHOW?
Since 2010, most comparison states have reduced their higher education spending per full-time student, even as the nation emerged from the Great Recession. But, Louisiana’s decline in spending per student, from $7,210 in 2010 to $5,154 in 2015, is the greatest reduction of all comparison states. Illinois stands out as boosting its spending per full-time student from $8,778 in 2010 to $11,627 in 2015. And, North Carolina maintained a consistently higher than average level of appropriations at roughly $8,000 per full-time student. To be sure, in 2015, Louisiana spent more on higher education per full-time student than Oregon, South Carolina, Pennsylvania, and Colorado.
Source: State Higher Education Executive Officers’ Association’s State Higher Education Finance: FY 2015 Report.