
The New Orleans Prosperity Index: Tricentennial Edition
Published: Apr 11, 2018
As New Orleans completes her 300th year, the tricentennial is an important moment to reflect on the city’s history and achievements. But in addition to celebrating their storied past, New Orleanians are eager to learn from it. Since 2005, when Katrina struck and the levees failed, New Orleanians have worked hard to rebuild their city better than before, preserving that which they treasure, while reforming and strengthening their institutions, and increasing opportunities for prosperity. The tricentennial represents an auspicious occasion for both celebration and reflection.
Executive Summary
There is no doubt that New Orleans’ global reputation is now and has long been dominated by its distinctive culture, born of a diverse blending of peoples, and mother of America’s most popular music traditions as well as a unique culinary palate.3 But, New Orleans was not founded as an intentional experiment in diversity. New Orleans was established in 1718 to profit the Company of the West, a French corporation.4 The common approach to profit-making during this era was through the exploitation of natural and human resources. Initially the Company recruited French and German immigrants, but also sent criminals to settle the new city.5 As early as 1719, the Company began importing African captives.6 The colonial census of 1721 recorded 237 Europeans, 171 enslaved Africans, and 21 enslaved Native Americans in the new city of New Orleans.7 (See Reference Material: Native Americans in Prehistoric New Orleans).
For its first 85 years, under French and Spanish rule, this colony was unusual in the rights it accorded to the enslaved. For example, Spanish law (more so than French law) gave slaves the right to purchase their freedom.8 Indeed, at the time of the Louisiana Purchase in 1803, when New Orleans became part of the United States, its population was approximately one-third enslaved Africans, and one-fifth free people of African descent or “free people of color.” By 1810, the city’s population doubled when white and black Haitians immigrated to New Orleans in large numbers.9 By 1850, New Orleans hosted by far the largest population of “free people of color” in the South.10
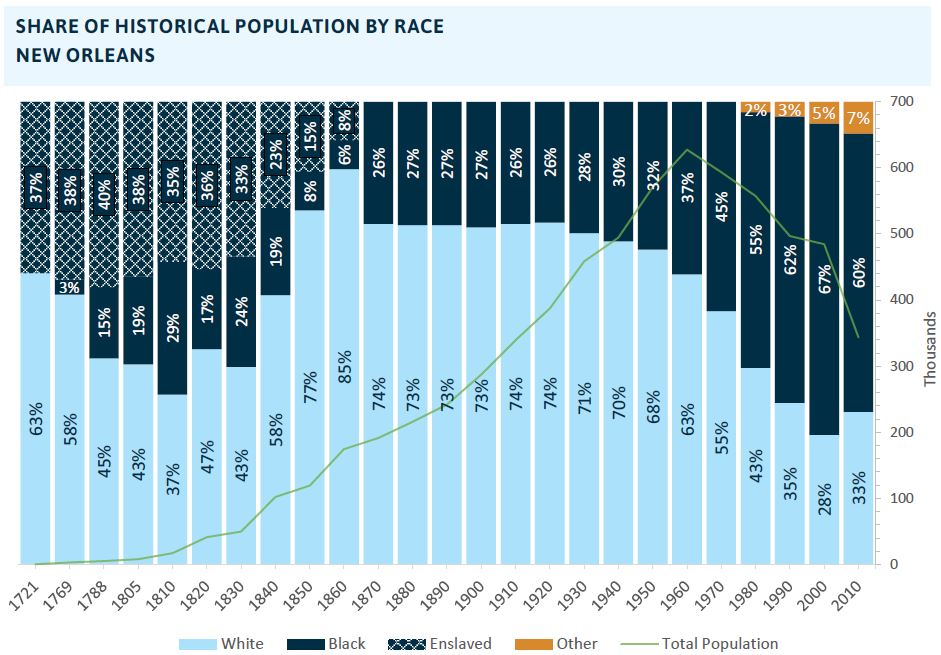
Source: See technical notes on page 58 of the report for full sources of population data.
Modern metrics of economic strength were not available early in New Orleans’ history, but population size serves as a reasonable proxy.11 By 1840, New Orleans was the third largest city in the United States.12 However, in the decades preceding the Civil War, as a new American state, Louisiana increasingly restricted the rights of New Orleans’ free people of color, and, between 1840 and 1860, many left for more welcoming environments in the north and abroad,13 while the city’s ranking slipped to sixth.14 In the hundred years from 1860 to 1960, New Orleans’ population grew, but not as quickly as some other US cities—its relative ranking falling to 15th.15 This century after the Civil War was marked by the “Jim Crow” apartheid system propagated in the American South, which restricted rights of New Orleans’ previously free people of color even further, and against which black New Orleanians railed.16 Only in the last 50 years have black New Orleanians had the possibility of fully participating in the city’s economic mainstream.
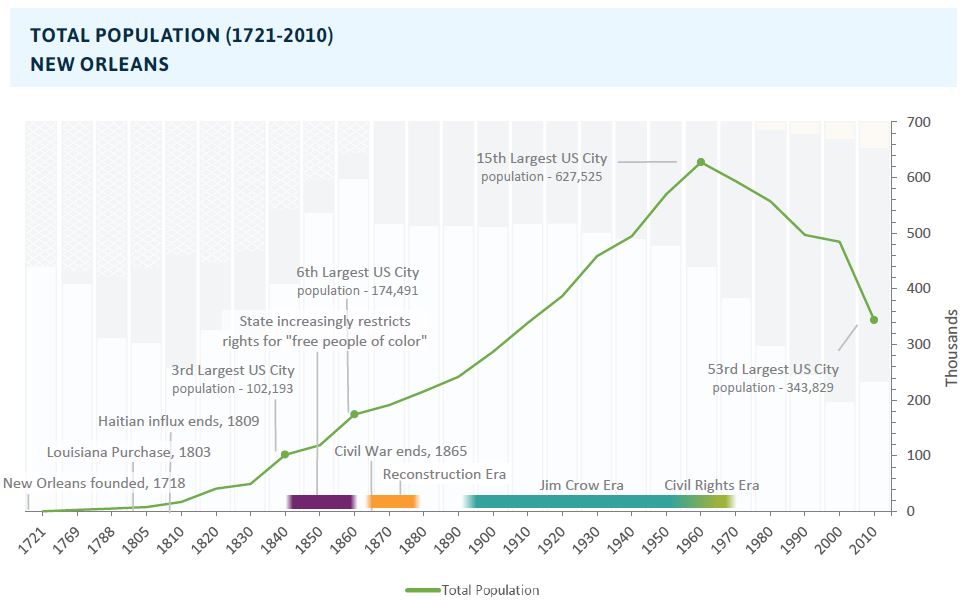
Source: City rankings in 1840, 1860, and 1960 are from the book “Bienville’s Dilemma” by Richard Campenella; City ranking in 2010 is from the U.S. Census Bureau.
While economic inclusion was not the focus of the city’s first 250 years, economic inclusion is increasingly important for fostering growth in developed economies. New research suggests that U.S. cities and regions that offer greater equality of opportunity experience greater economic growth, by maximizing the potential of their human capital, and minimizing the fiscal costs of exclusion.17 With this mounting evidence in mind, this edition of The Prosperity Index examines the question: “Have African American New Orleanians experienced increased economic inclusion since the end of the Civil Rights era?”
In addition, a growing economy depends on many systems to address barriers that hinder workers and firms. For example, schools help develop a skilled and educated workforce. Housing development can ensure that workers are not physically isolated from jobs. Health care and public health systems address a key determining factor in many adults’ ability to work. Therefore, The Prosperity Index also analyzes multiple indicators to assess which systems are producing good or poor outcomes for people of color in New Orleans.
To be sure, whites have experienced poverty and exclusion in New Orleans as well. But as recently as 2016, the poverty rate among black New Orleanians was 32 percent while the poverty rate among white New Orleanians was nine percent revealing that race remains a clear dividing line for economic success. The small but growing Hispanic and Asian communities in New Orleans also experience poverty at higher rates than whites (although the higher Asian poverty rate does not register as statistically significant, likely due to small sample sizes).18 As people of color make up larger and larger shares of working-age populations, economic success becomes more and more dependent upon the ability of all racial and ethnic groups to be performing at their utmost potential and participating fully in the economy. Moreover, large disparities across groups undermine social cohesion and therefore resiliency. Aiming to inform a future vision for New Orleans, The New Orleans Prosperity Index provides crucial information that assesses the city’s prosperity and resilience potential and reveals areas of strength and weakness across multiple systems. Our findings reveal:
Employment and Income
- Since 1979, across the U.S. white household income has grown only six percent and black income has grown five percent after adjusting for inflation. In metro New Orleans, white income has held steady since 1979—while black household incomes have actually fallen 7 percent.
- Among the metro’s families in 2016, lower income blacks are more likely to live in the city, while higher income whites are equally likely to live in the city and the suburbs.
- Black households earned 63 percent less and Hispanic households earned 47 percent less than white households in New Orleans in 2016. Half of all black families in New Orleans earned less than $25,324.
- The share of New Orleans’ white households in the highest income quintile expanded from 24 percent in 1979, such that by 2016, 29 percent of white households earned more than $114,632. In contrast, the share of black households in this tier has shrunk from 9 percent in 1979 to 6 percent in 2016. Instead, the share of black households in the lowest tier grew from 41 percent, such that by 2016, 47 percent of black households earned less than $23,237.
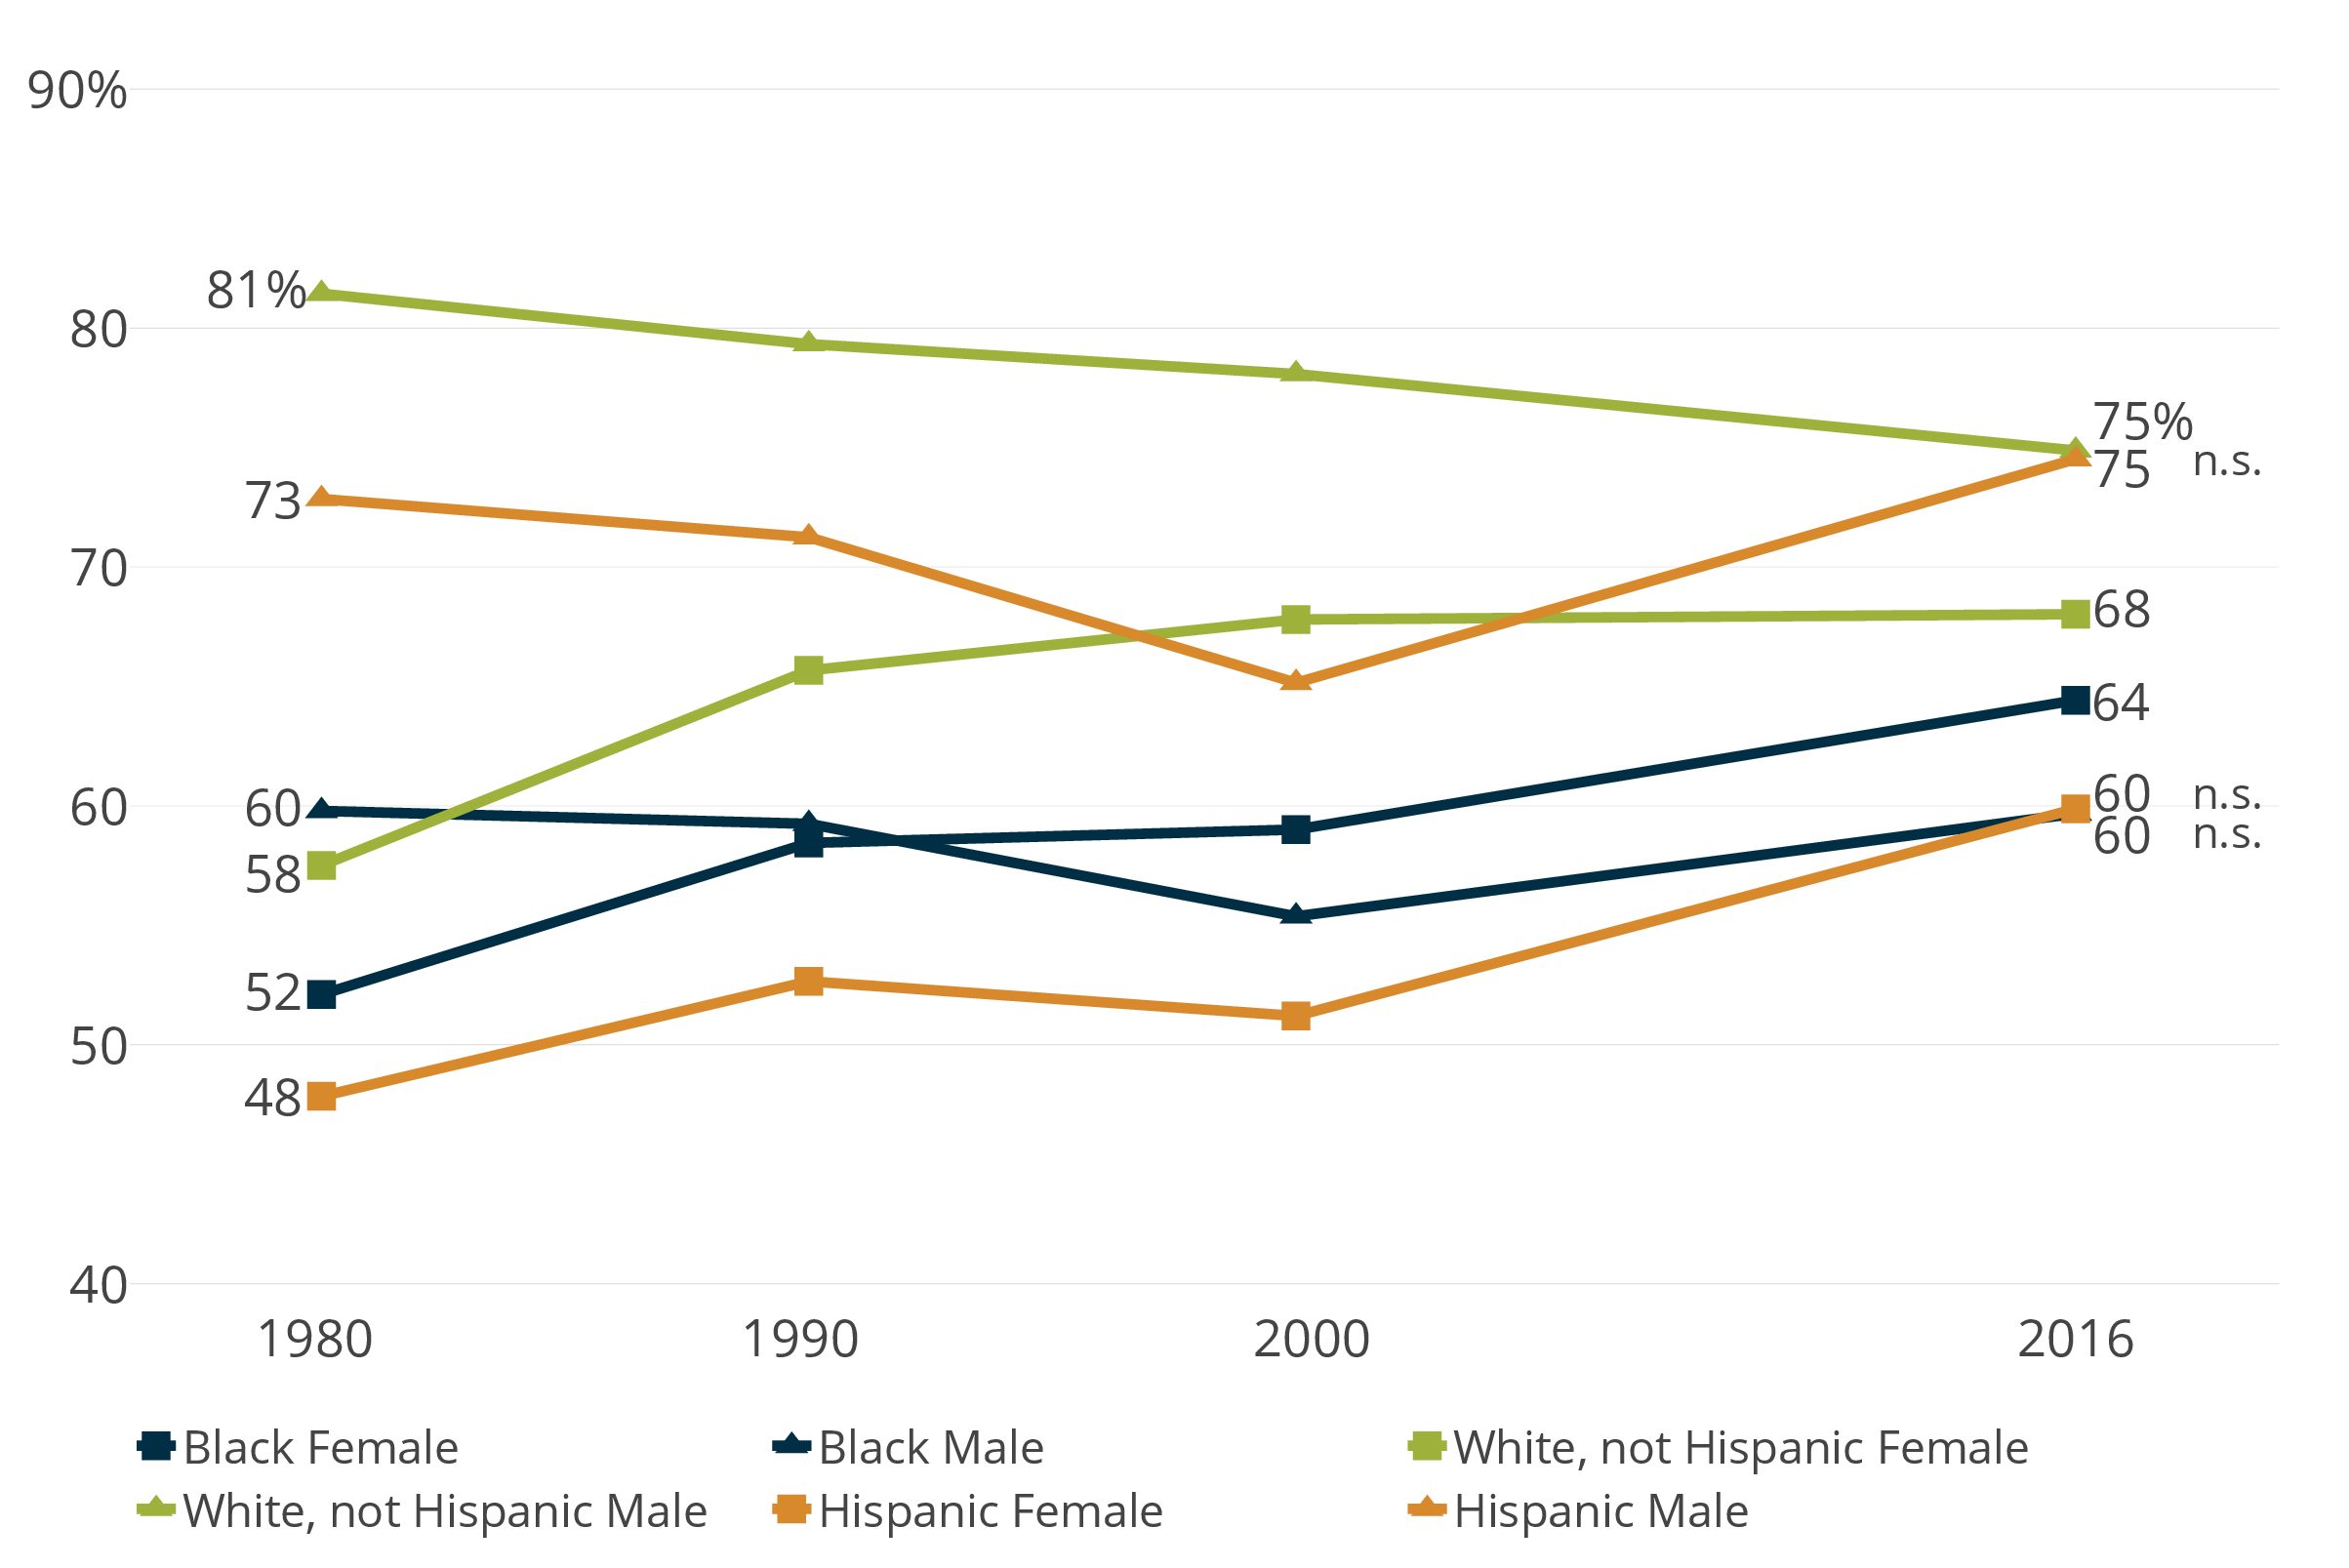
- Since 1980, employment rates have risen slightly for white men in New Orleans from 76 to 79 percent in 2016, and have expanded for white women from 55 to 74 percent. Employment rates have risen for Hispanic women from 53 to 67 percent. For black women employment rates have grown from 48 percent to 59 percent. Only for black men have employment rates fallen from 63 percent in 1980 down to 52 percent in 2016.
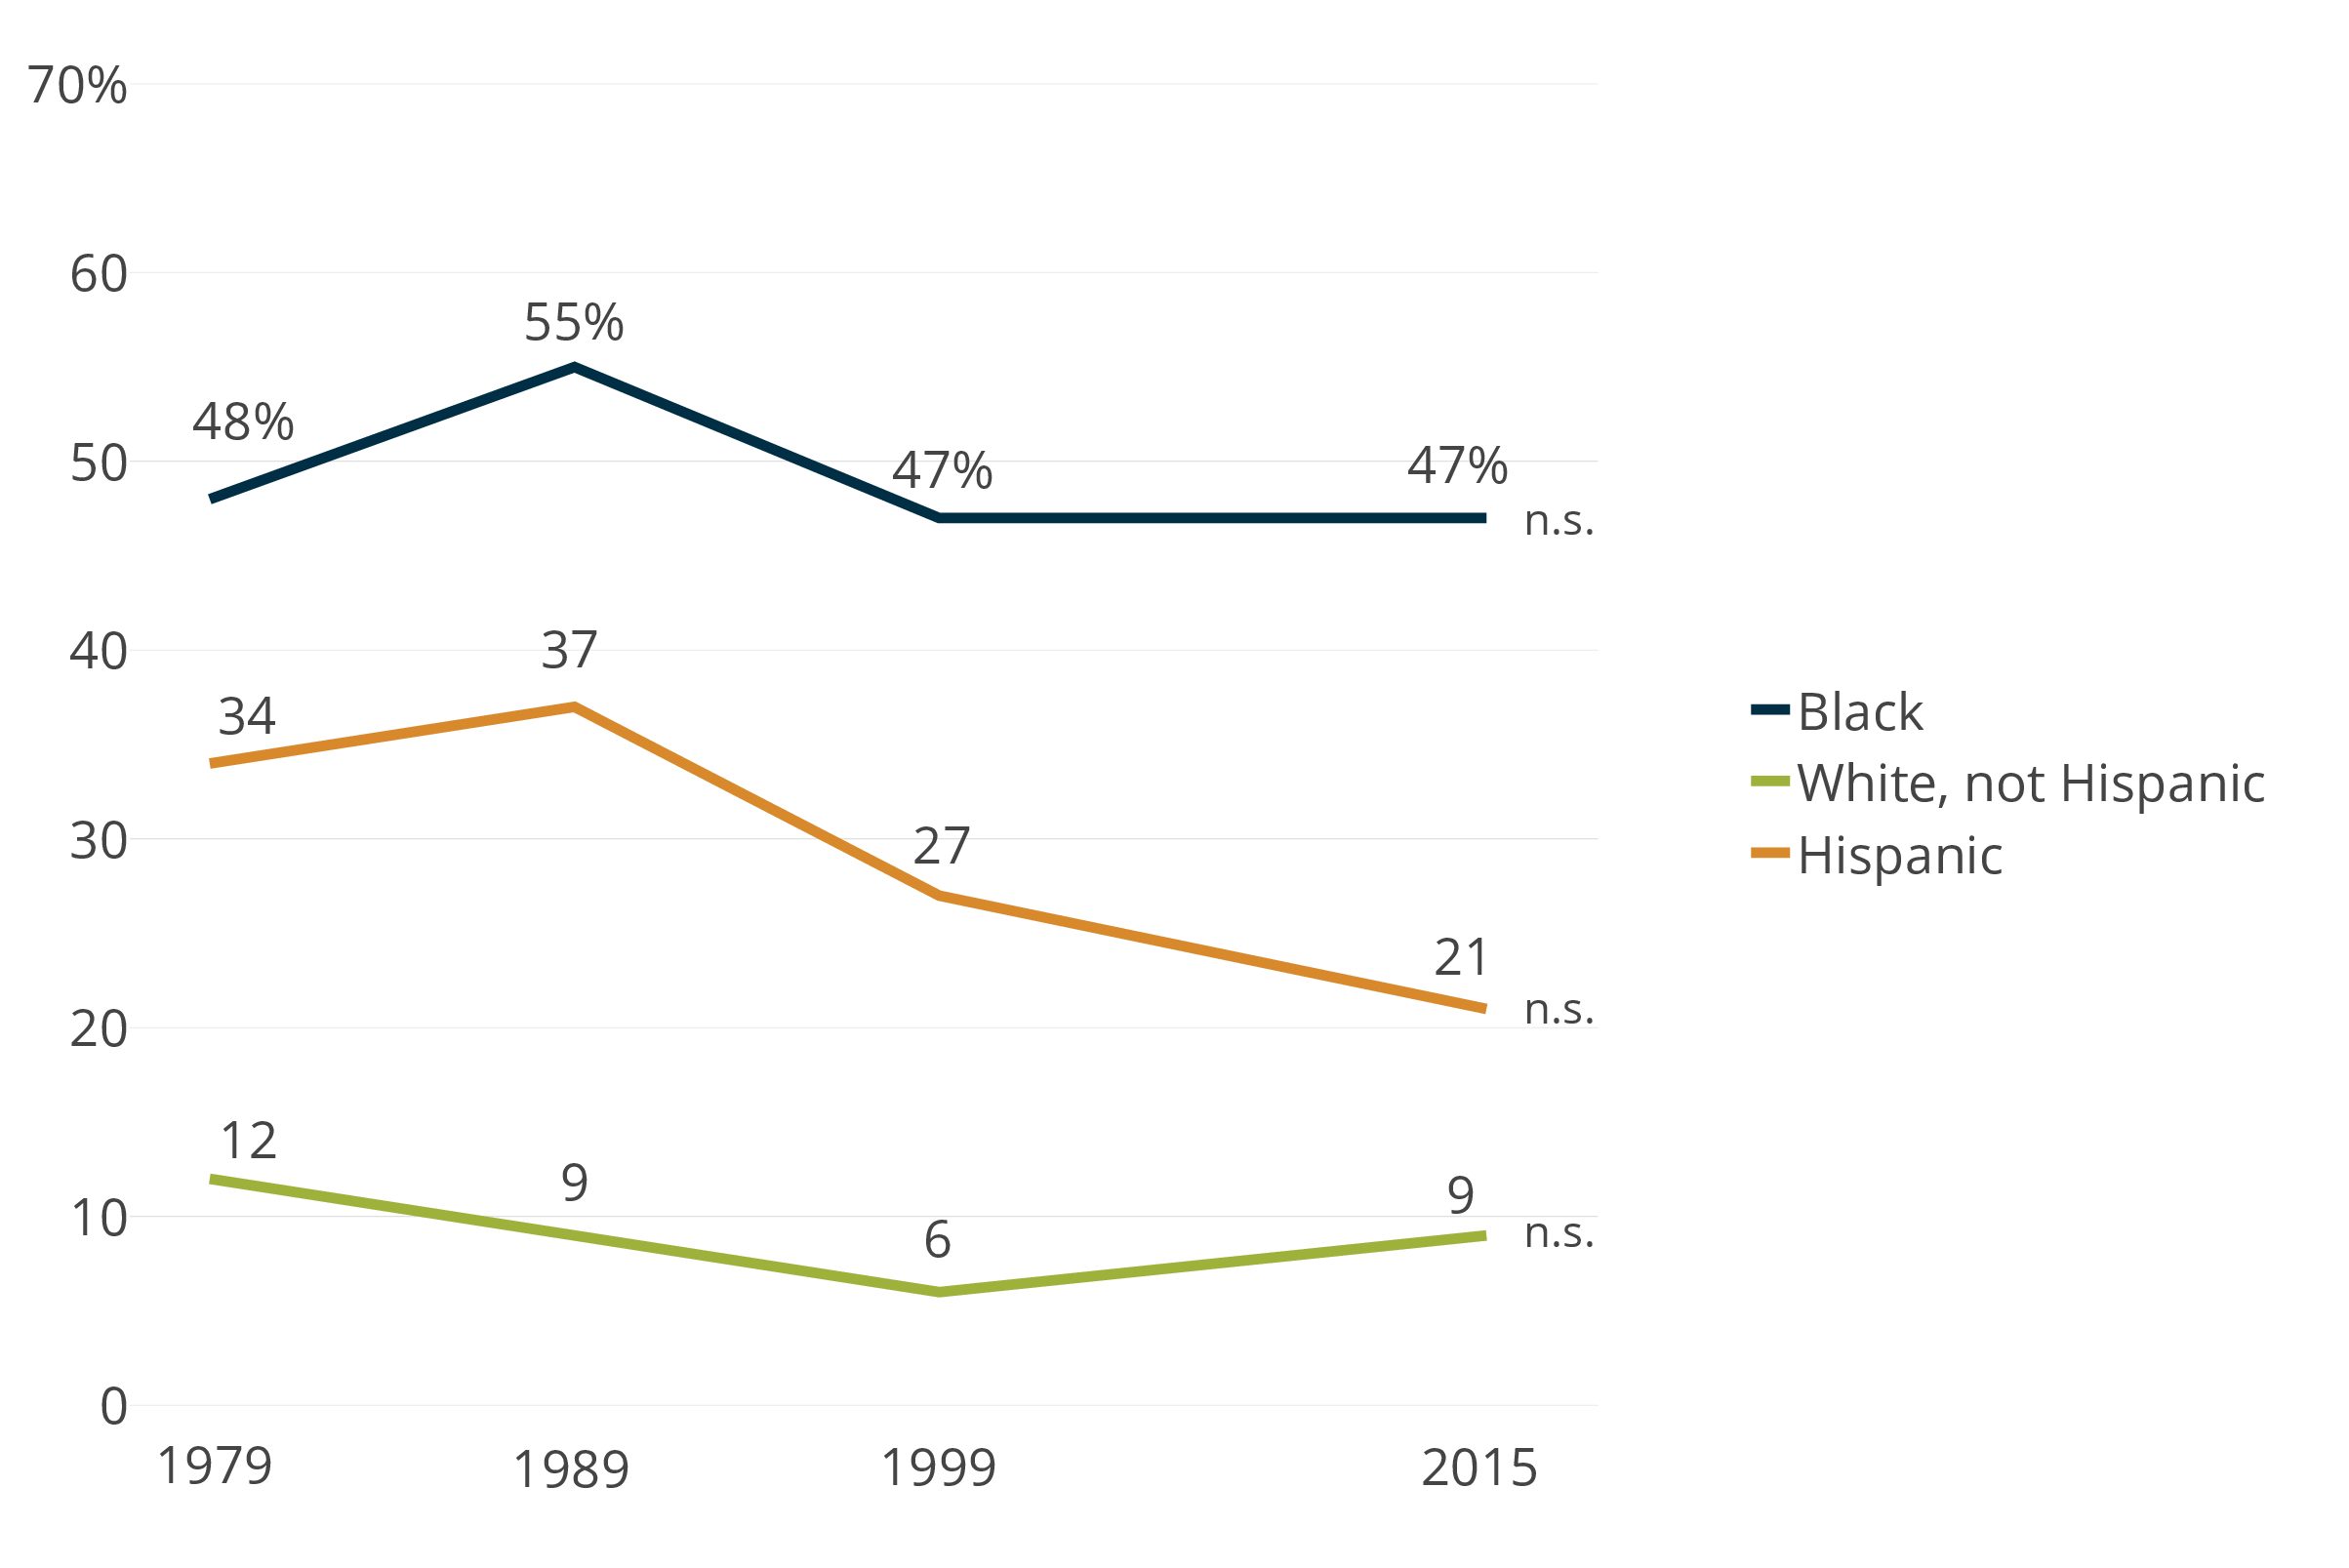
- In New Orleans, child poverty rates are little different than in 1979 for African American and white children. Nearly half of all African American children live in poverty while only 9 percent of white children are poor.
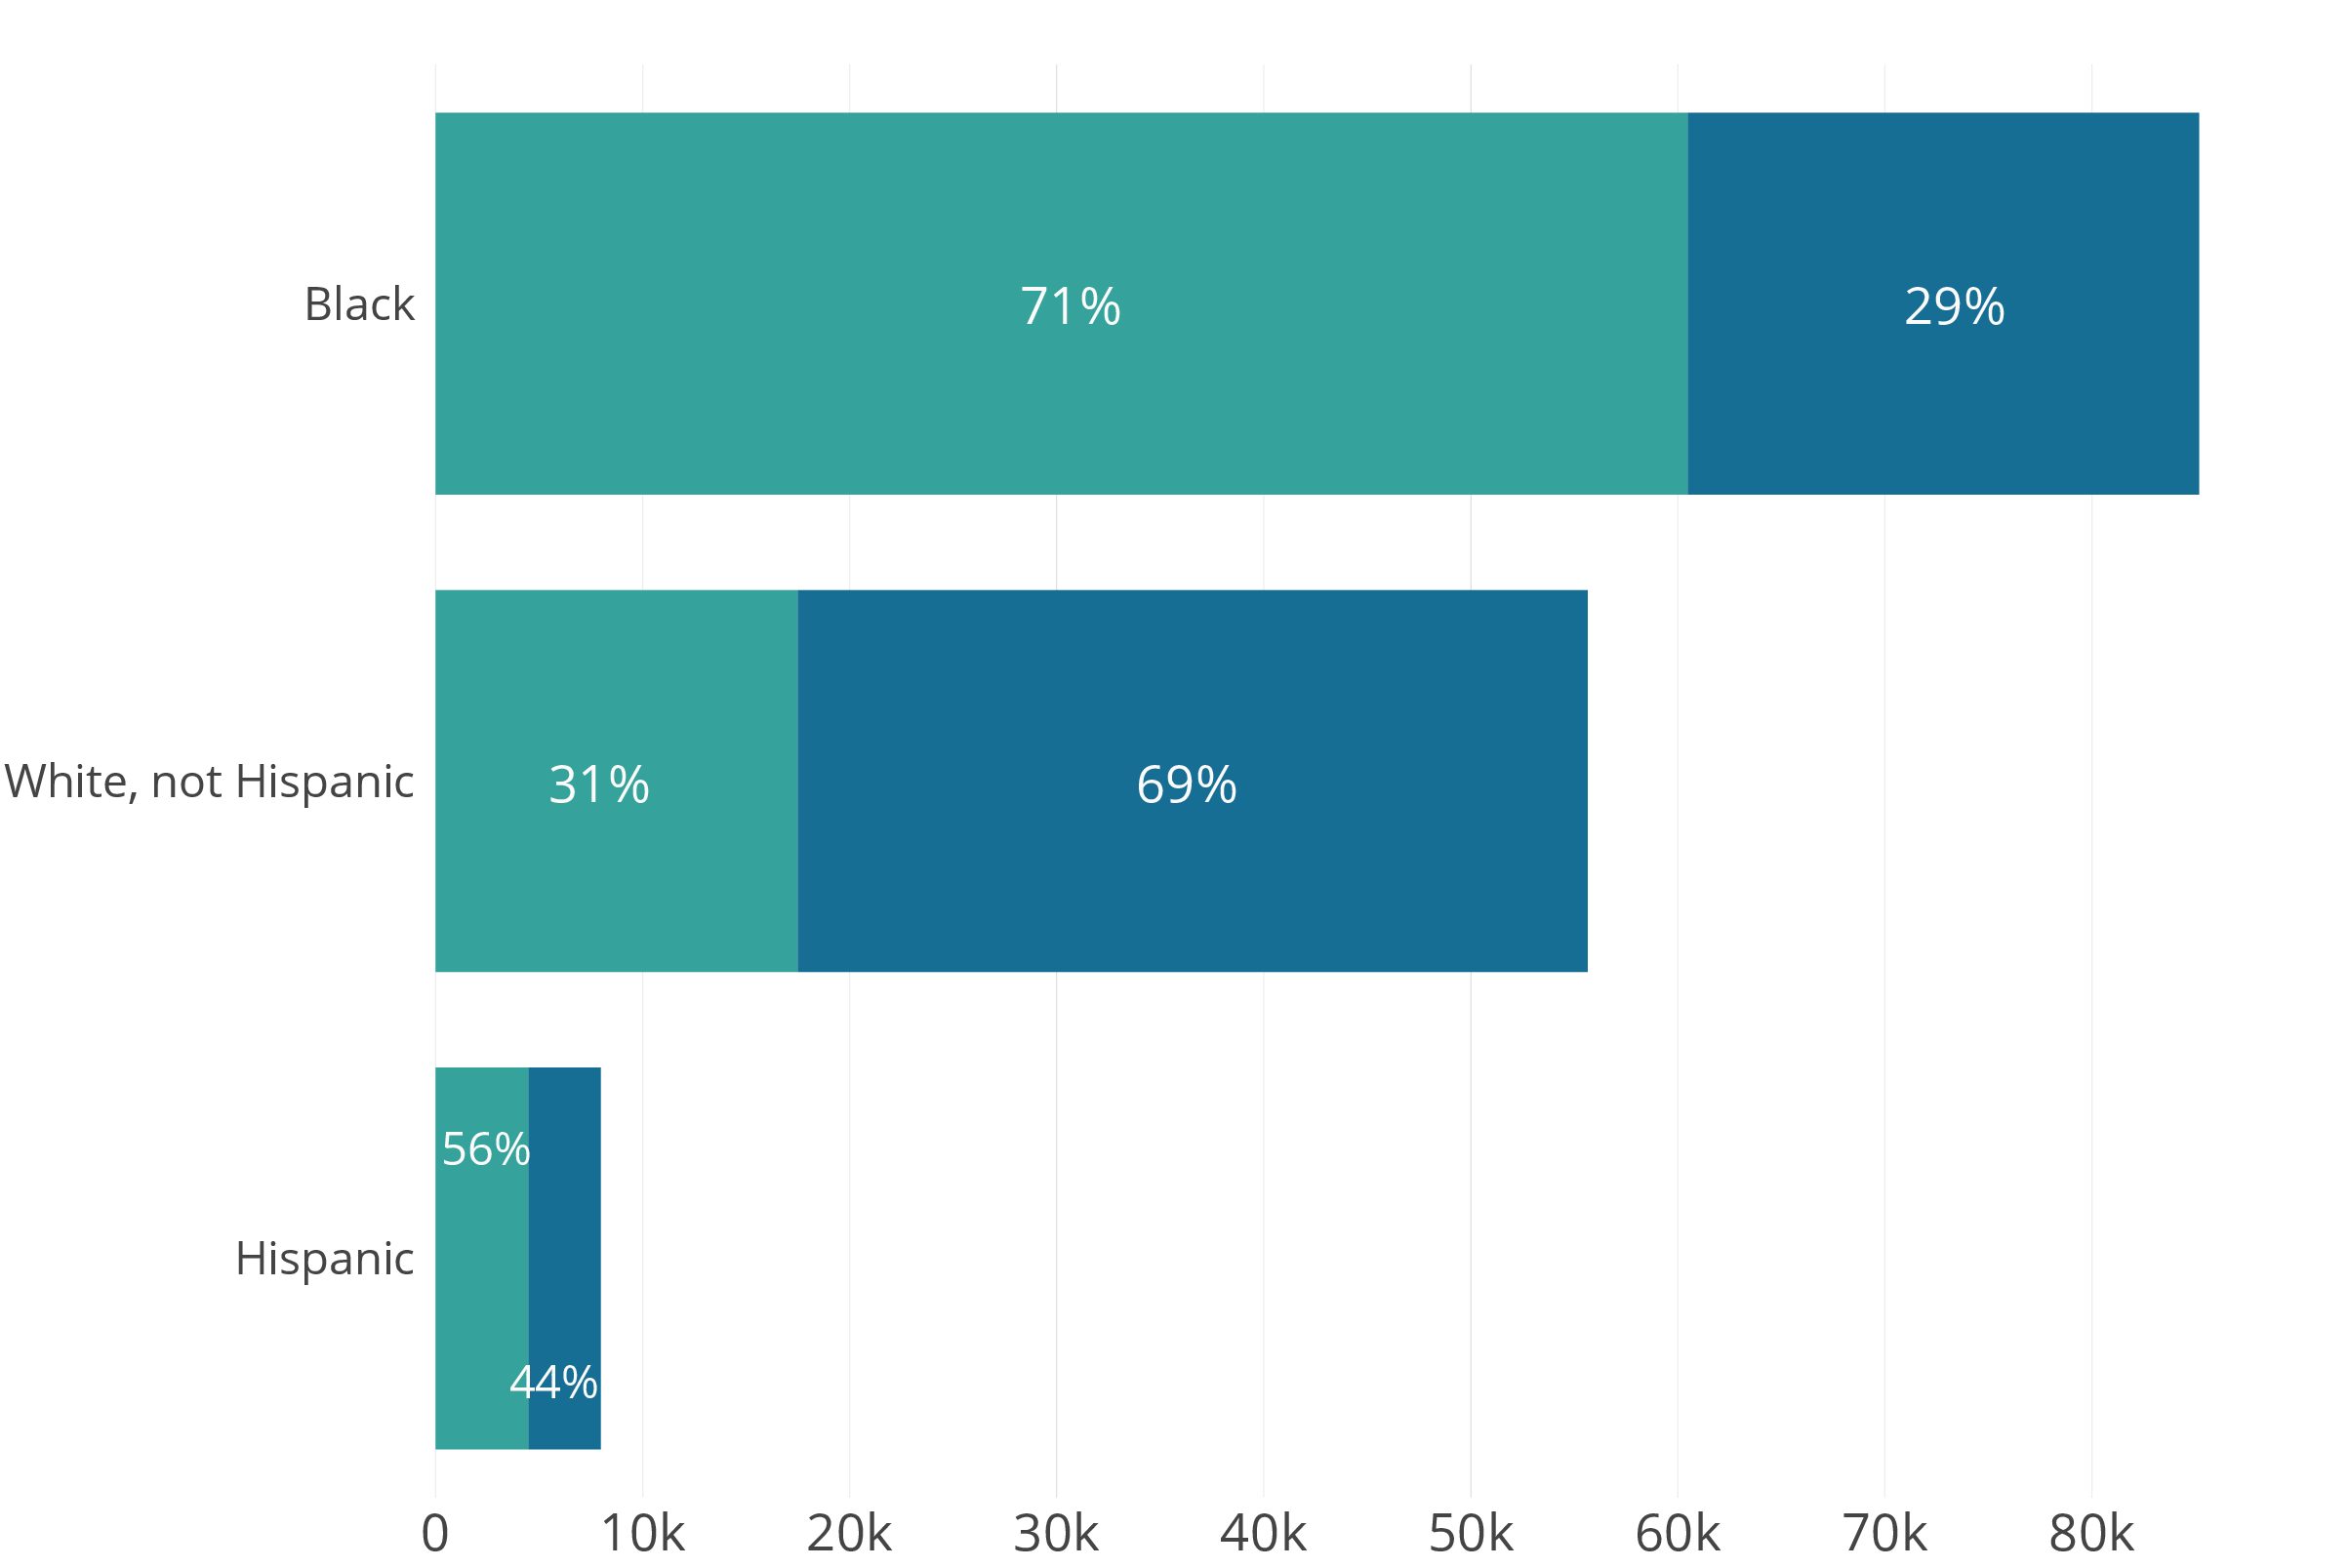
- A living wage, which would allow a family of one adult and one child to subsist without government assistance in New Orleans, was $22.89 per hour or $47,611 in 2016 according to MIT. Roughly 4,500 Hispanic households, 17,500 white households, and 60,500 black households earned less than $45,000 in New Orleans in 2016.
- With more than 15,000 jobs, tourism is the largest traded or “export” cluster in New Orleans, but with average wages, including tips, of only $34,220 and a workforce that is 50 percent black and 8 percent Hispanic, it is not providing family-sustaining wages to many families in New Orleans. Performing arts is similar in wages and workforce, albeit with only 2,330 jobs.
- The “hospitality” cluster (which includes fast food and full service restaurants), with nearly 29,000 jobs in New Orleans, average wages of $22,069 including tips, and a workforce that is 51 percent white, is also not providing family-sustaining wages to many families in New Orleans. Health services pays substantially higher wages averaging $49,748, and has over 19,000 jobs filled by a workforce that is 47 percent black.
- While African Americans account for a growing share of business owners in New Orleans—from 21 percent in 1997 to 40 percent in 2012—their receipts have remained stagnant at roughly two percent over that time frame. The share of businesses owned by Hispanics and Asians has remained approximately four percent and five percent, respectively, and received roughly one percent of receipts each.
Housing
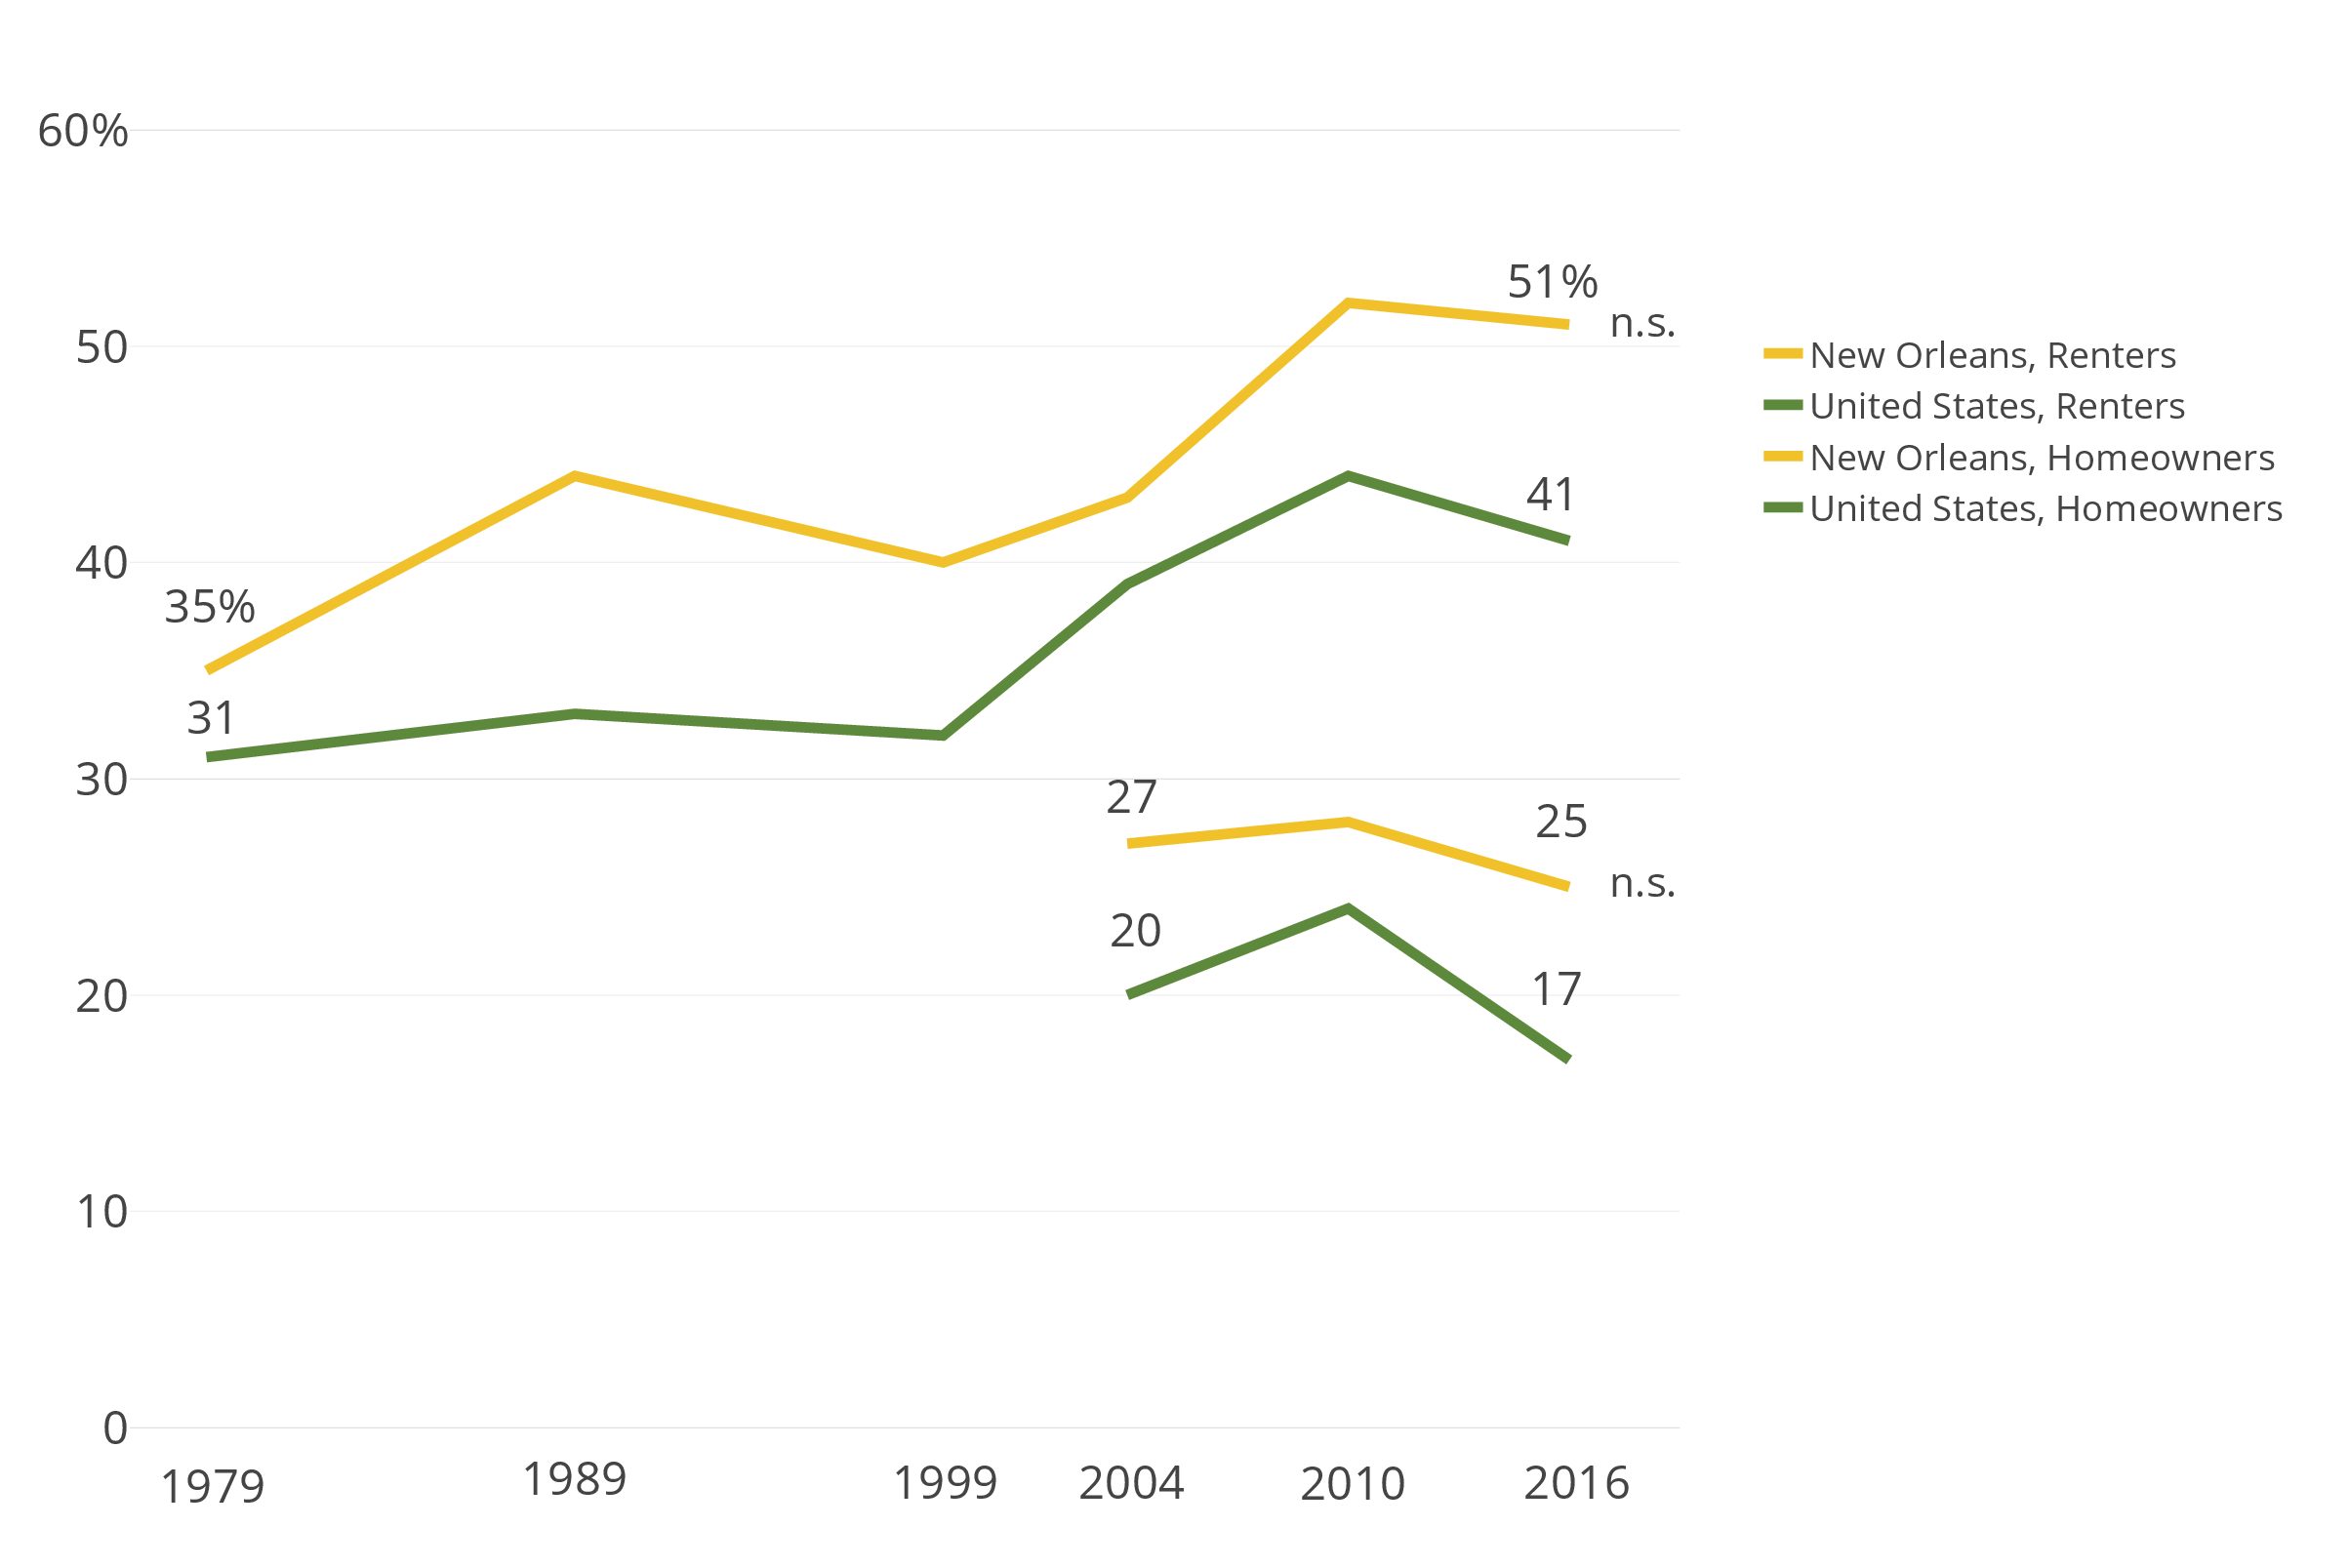
- While 54 percent of whites own their homes in New Orleans, only 41 percent of black New Orleanians are homeowners.
- Nearly 60 percent of black New Orleanians rent, and more than half of all renters paid unaffordable costs (35 percent of pre-tax household income) for housing in 2016—as compared to 41 percent of renters nationwide who pay unaffordable rents.
Democracy
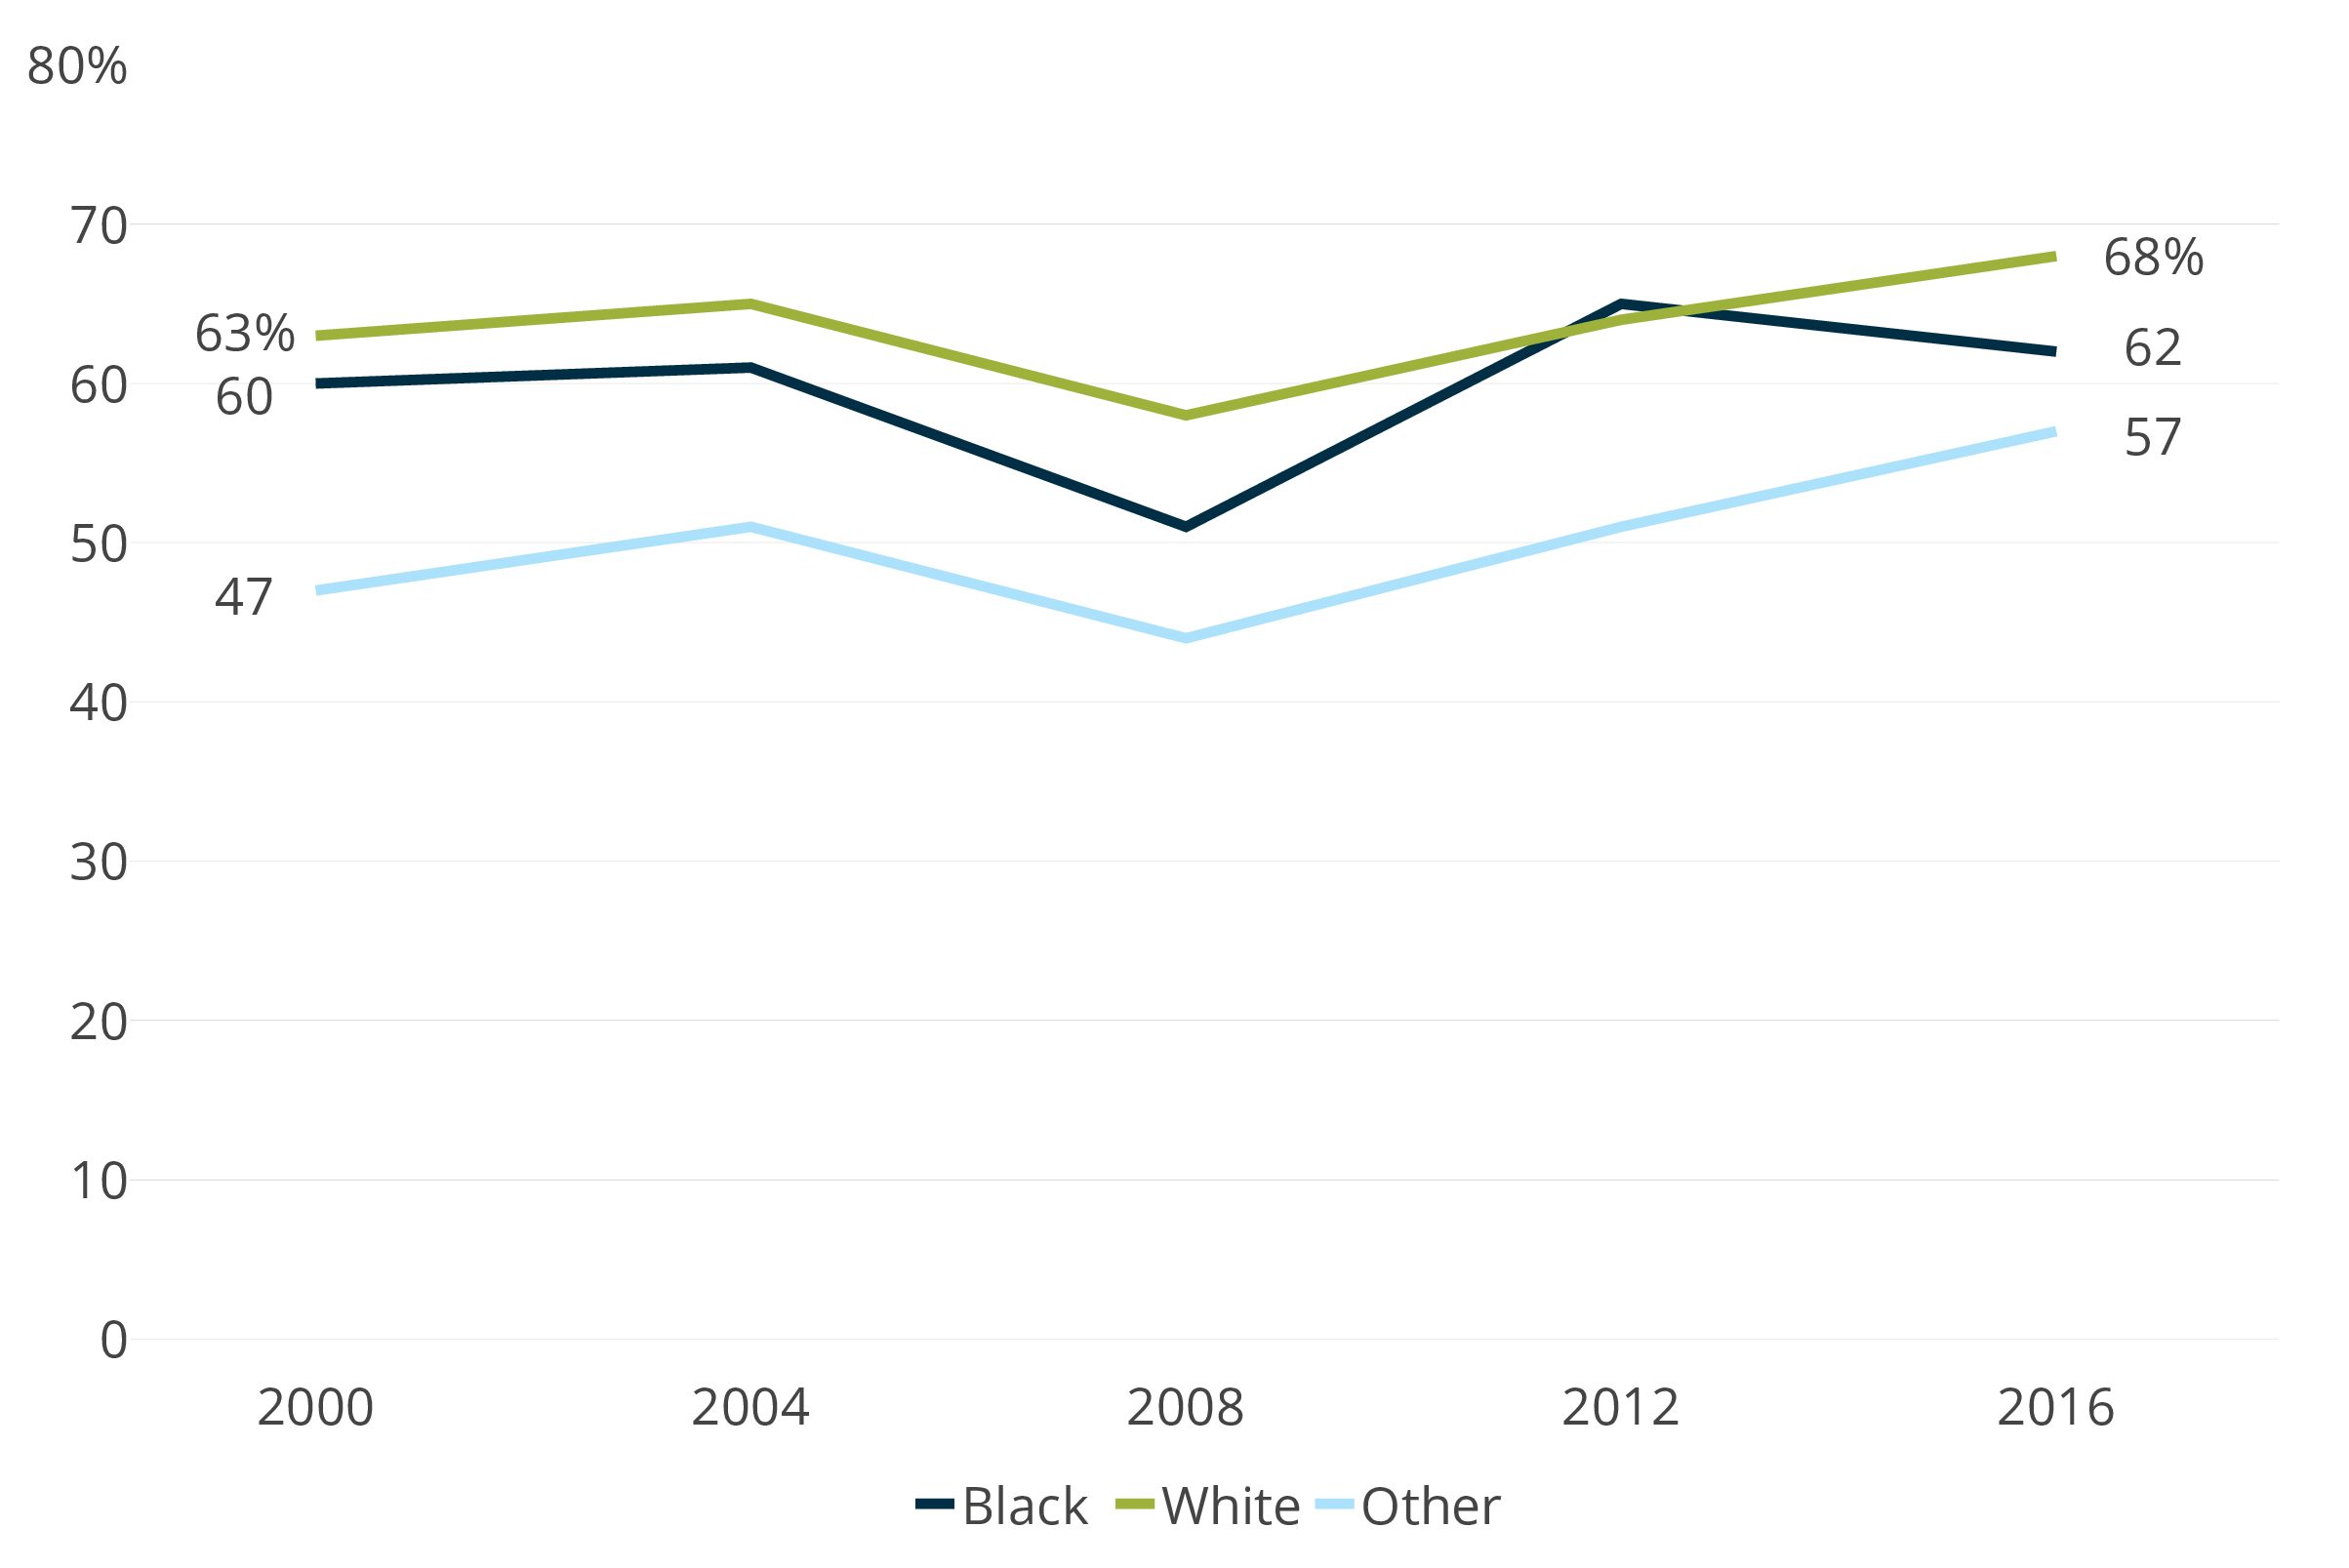
- Voter participation in presidential elections has been higher than in mayoral elections in New Orleans with 68 percent of white voters and 62 percent of black voters casting their ballot in the 2016 presidential election.
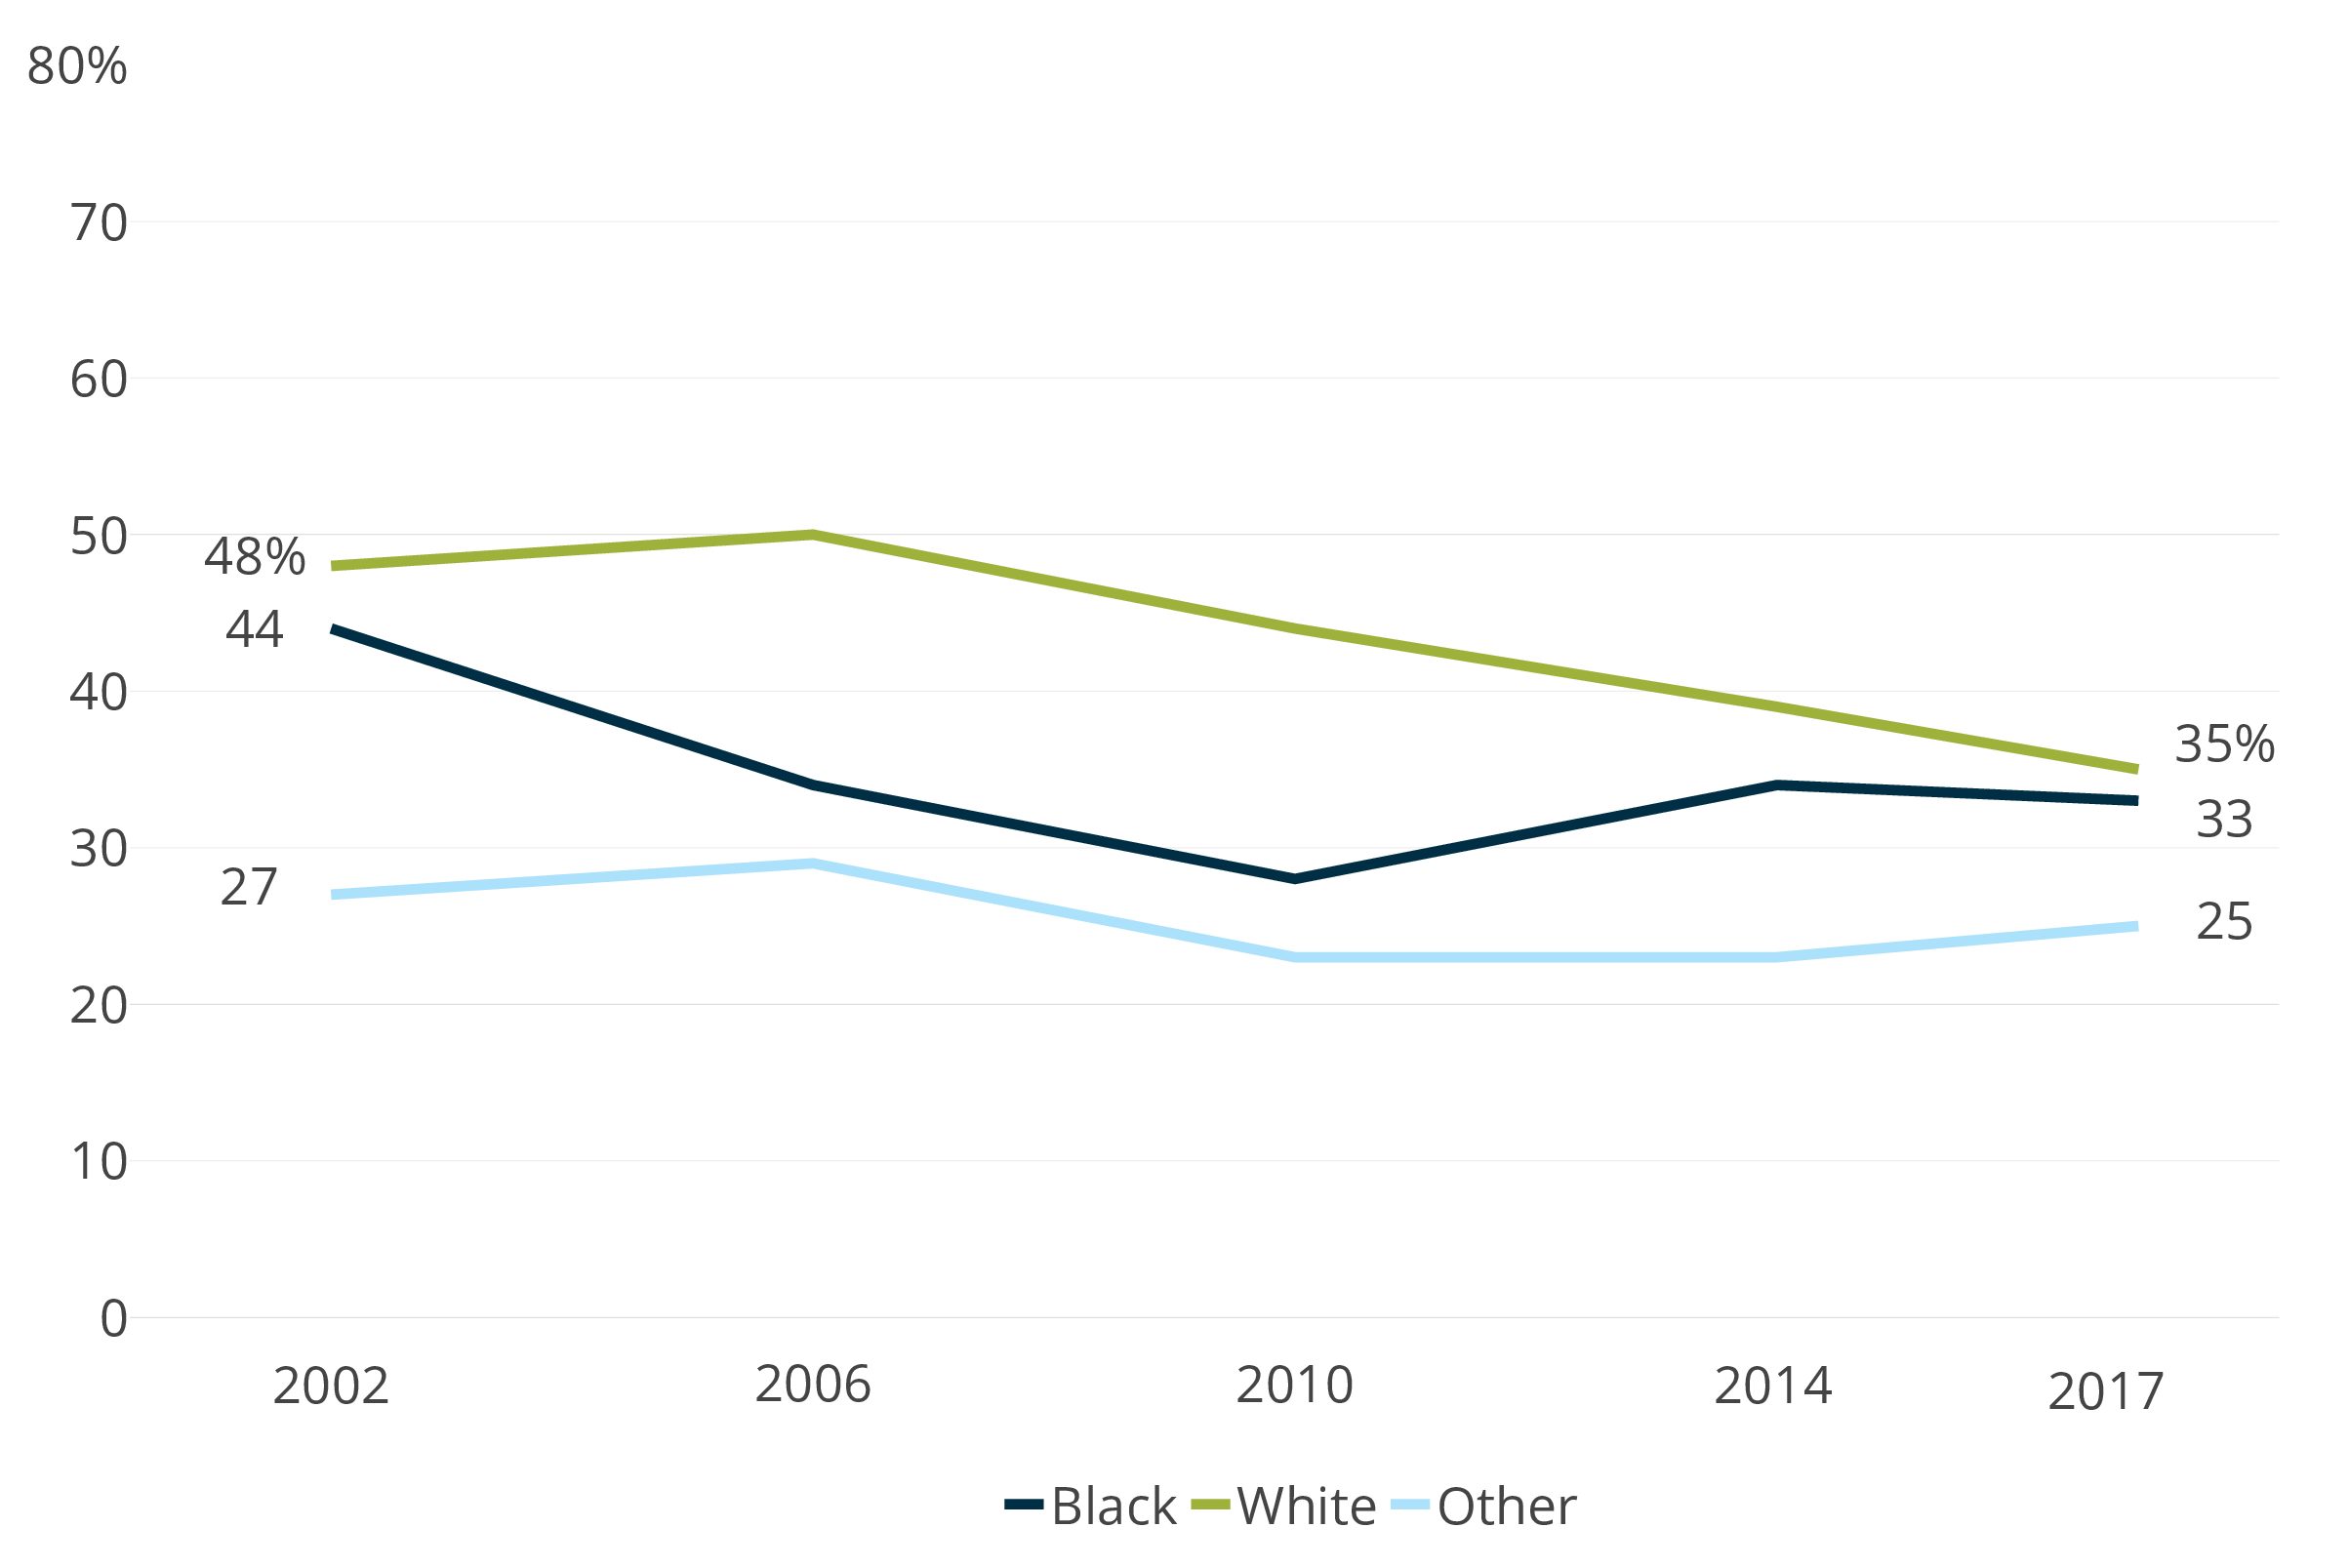
- Voter participation in mayoral elections has declined since 2002 such that in 2017 only 35 percent of white voters and 33 percent of black voters cast their ballot for mayor.
Health
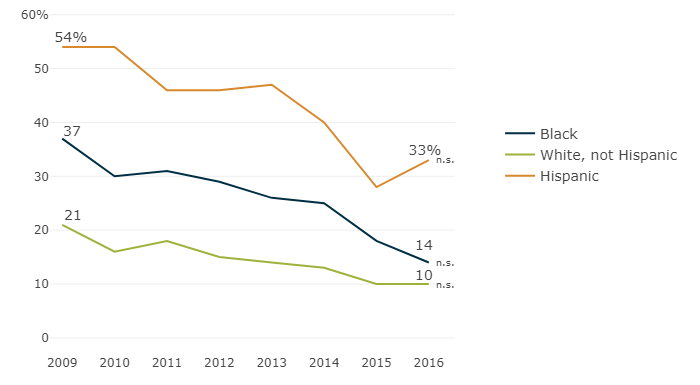
- The percent of white New Orleanians age 18 to 64 without health insurance decreased from 21 percent in 2009 to 10 percent in 2016. The shares of blacks without health insurance shrunk from 37 percent to 14 percent and Hispanics from 54 percent to 33 percent over the same time period.
- Age adjusted mortality from cancer, heart disease, and stroke has fallen since 1999, yet blacks are still 56 percent more likely to die from cancer or heart disease and 49 percent more likely to die of stroke than whites.
- In 2015, only 7.3 percent of white mothers in New Orleans had low birth weight babies, while 15 percent of black mothers had low birth weight babies.
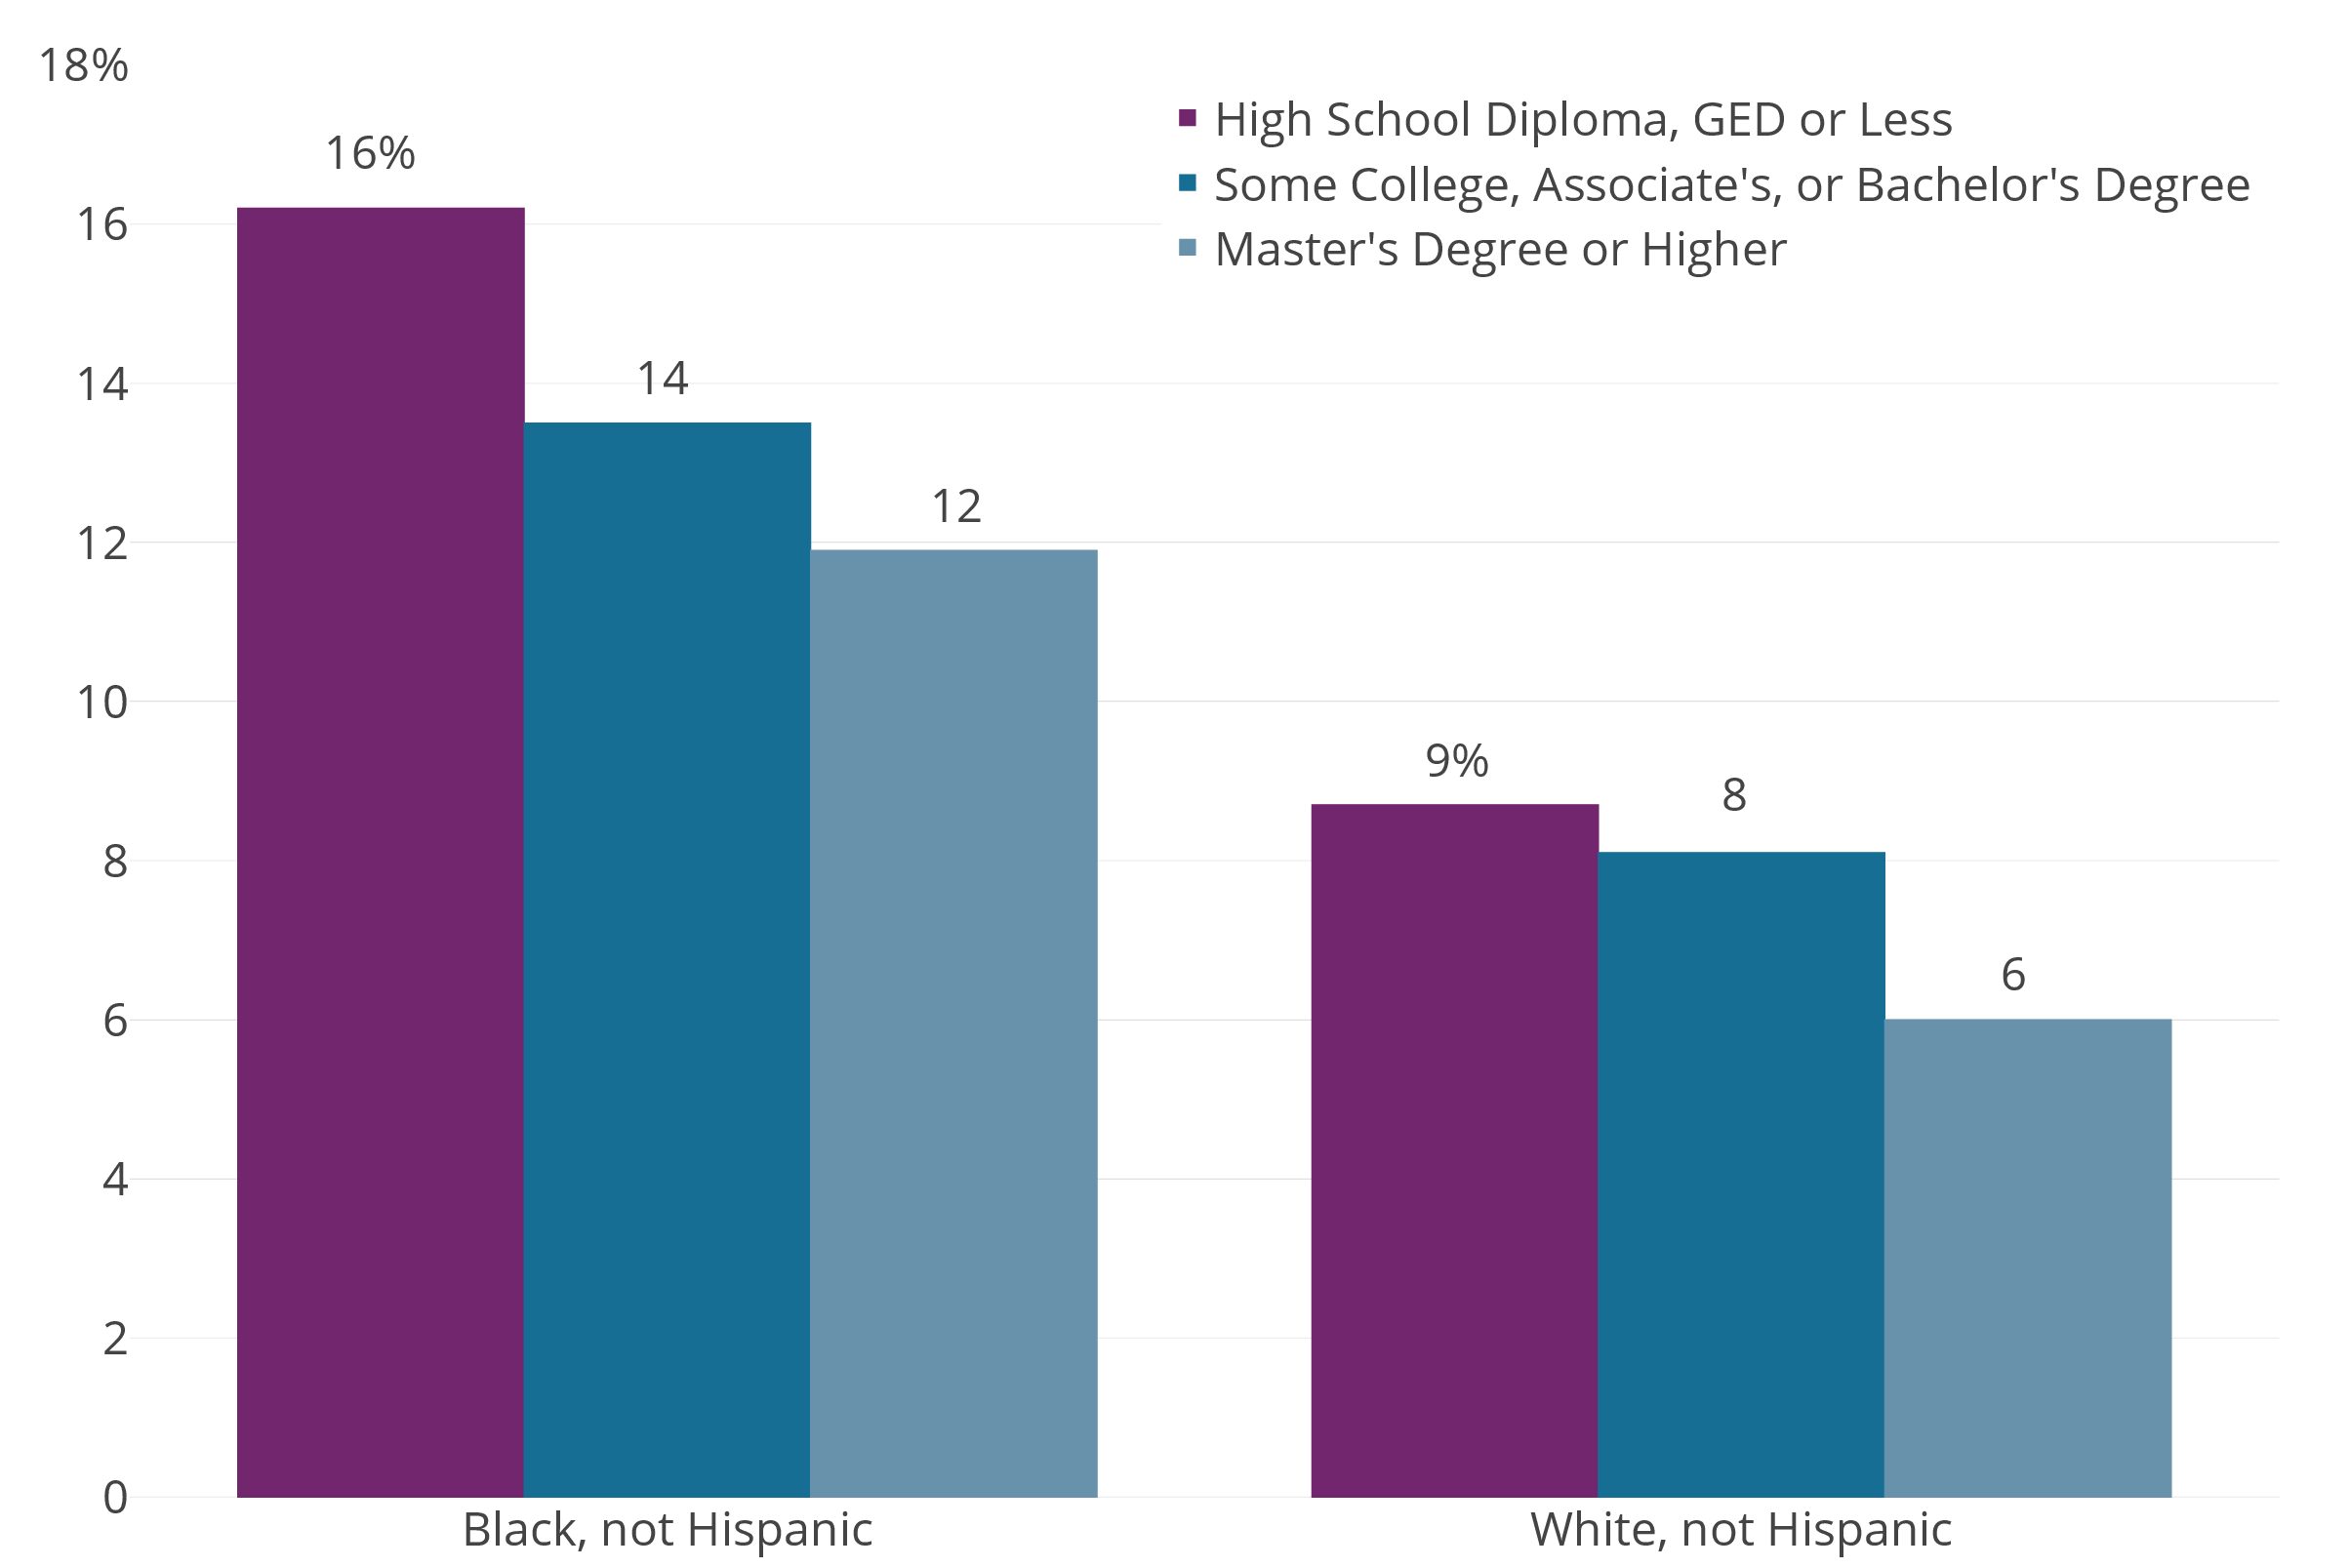
- Greater educational attainment decreased the risk of having a low birth weight baby, but even African American mothers with a master’s degree or higher had a greater likelihood (11.9 percent) of having a low birth weight baby than white mothers with a high school degree or less (8.7 percent).
Education
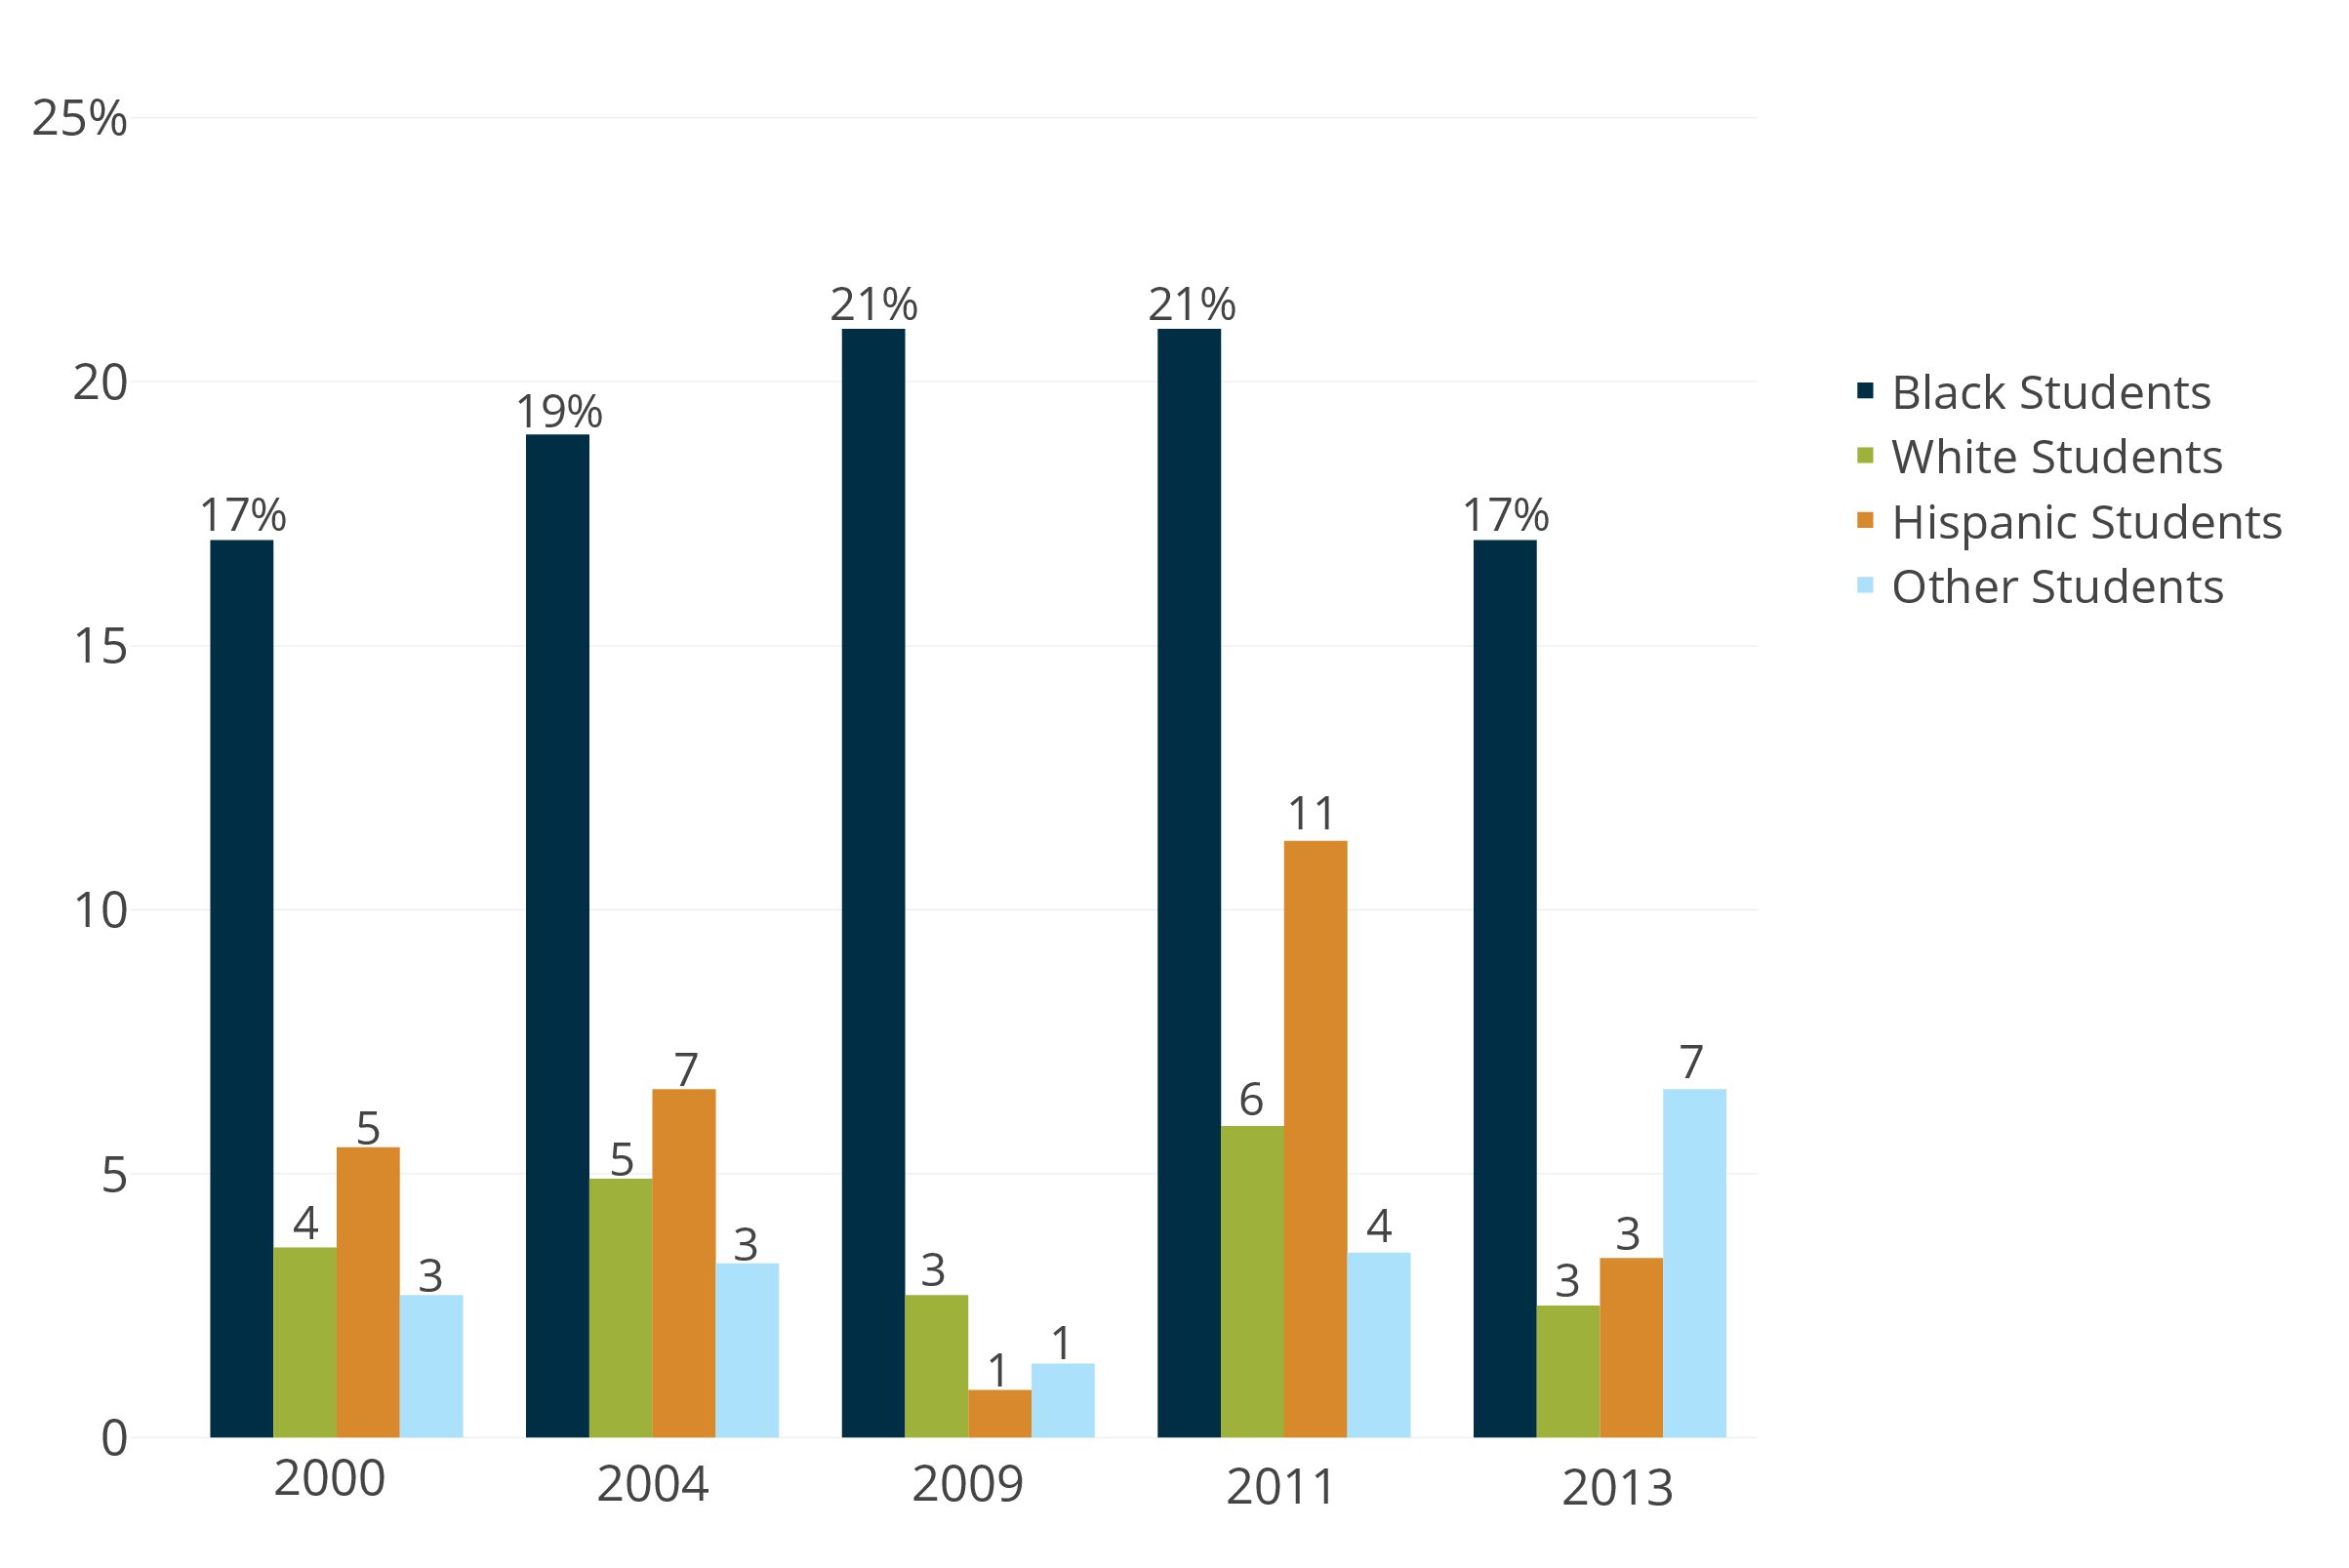
- As recently as 2013, fully 17 percent of African American students in New Orleans public schools were suspended. Black students were nearly seven times more likely to be suspended than white students.
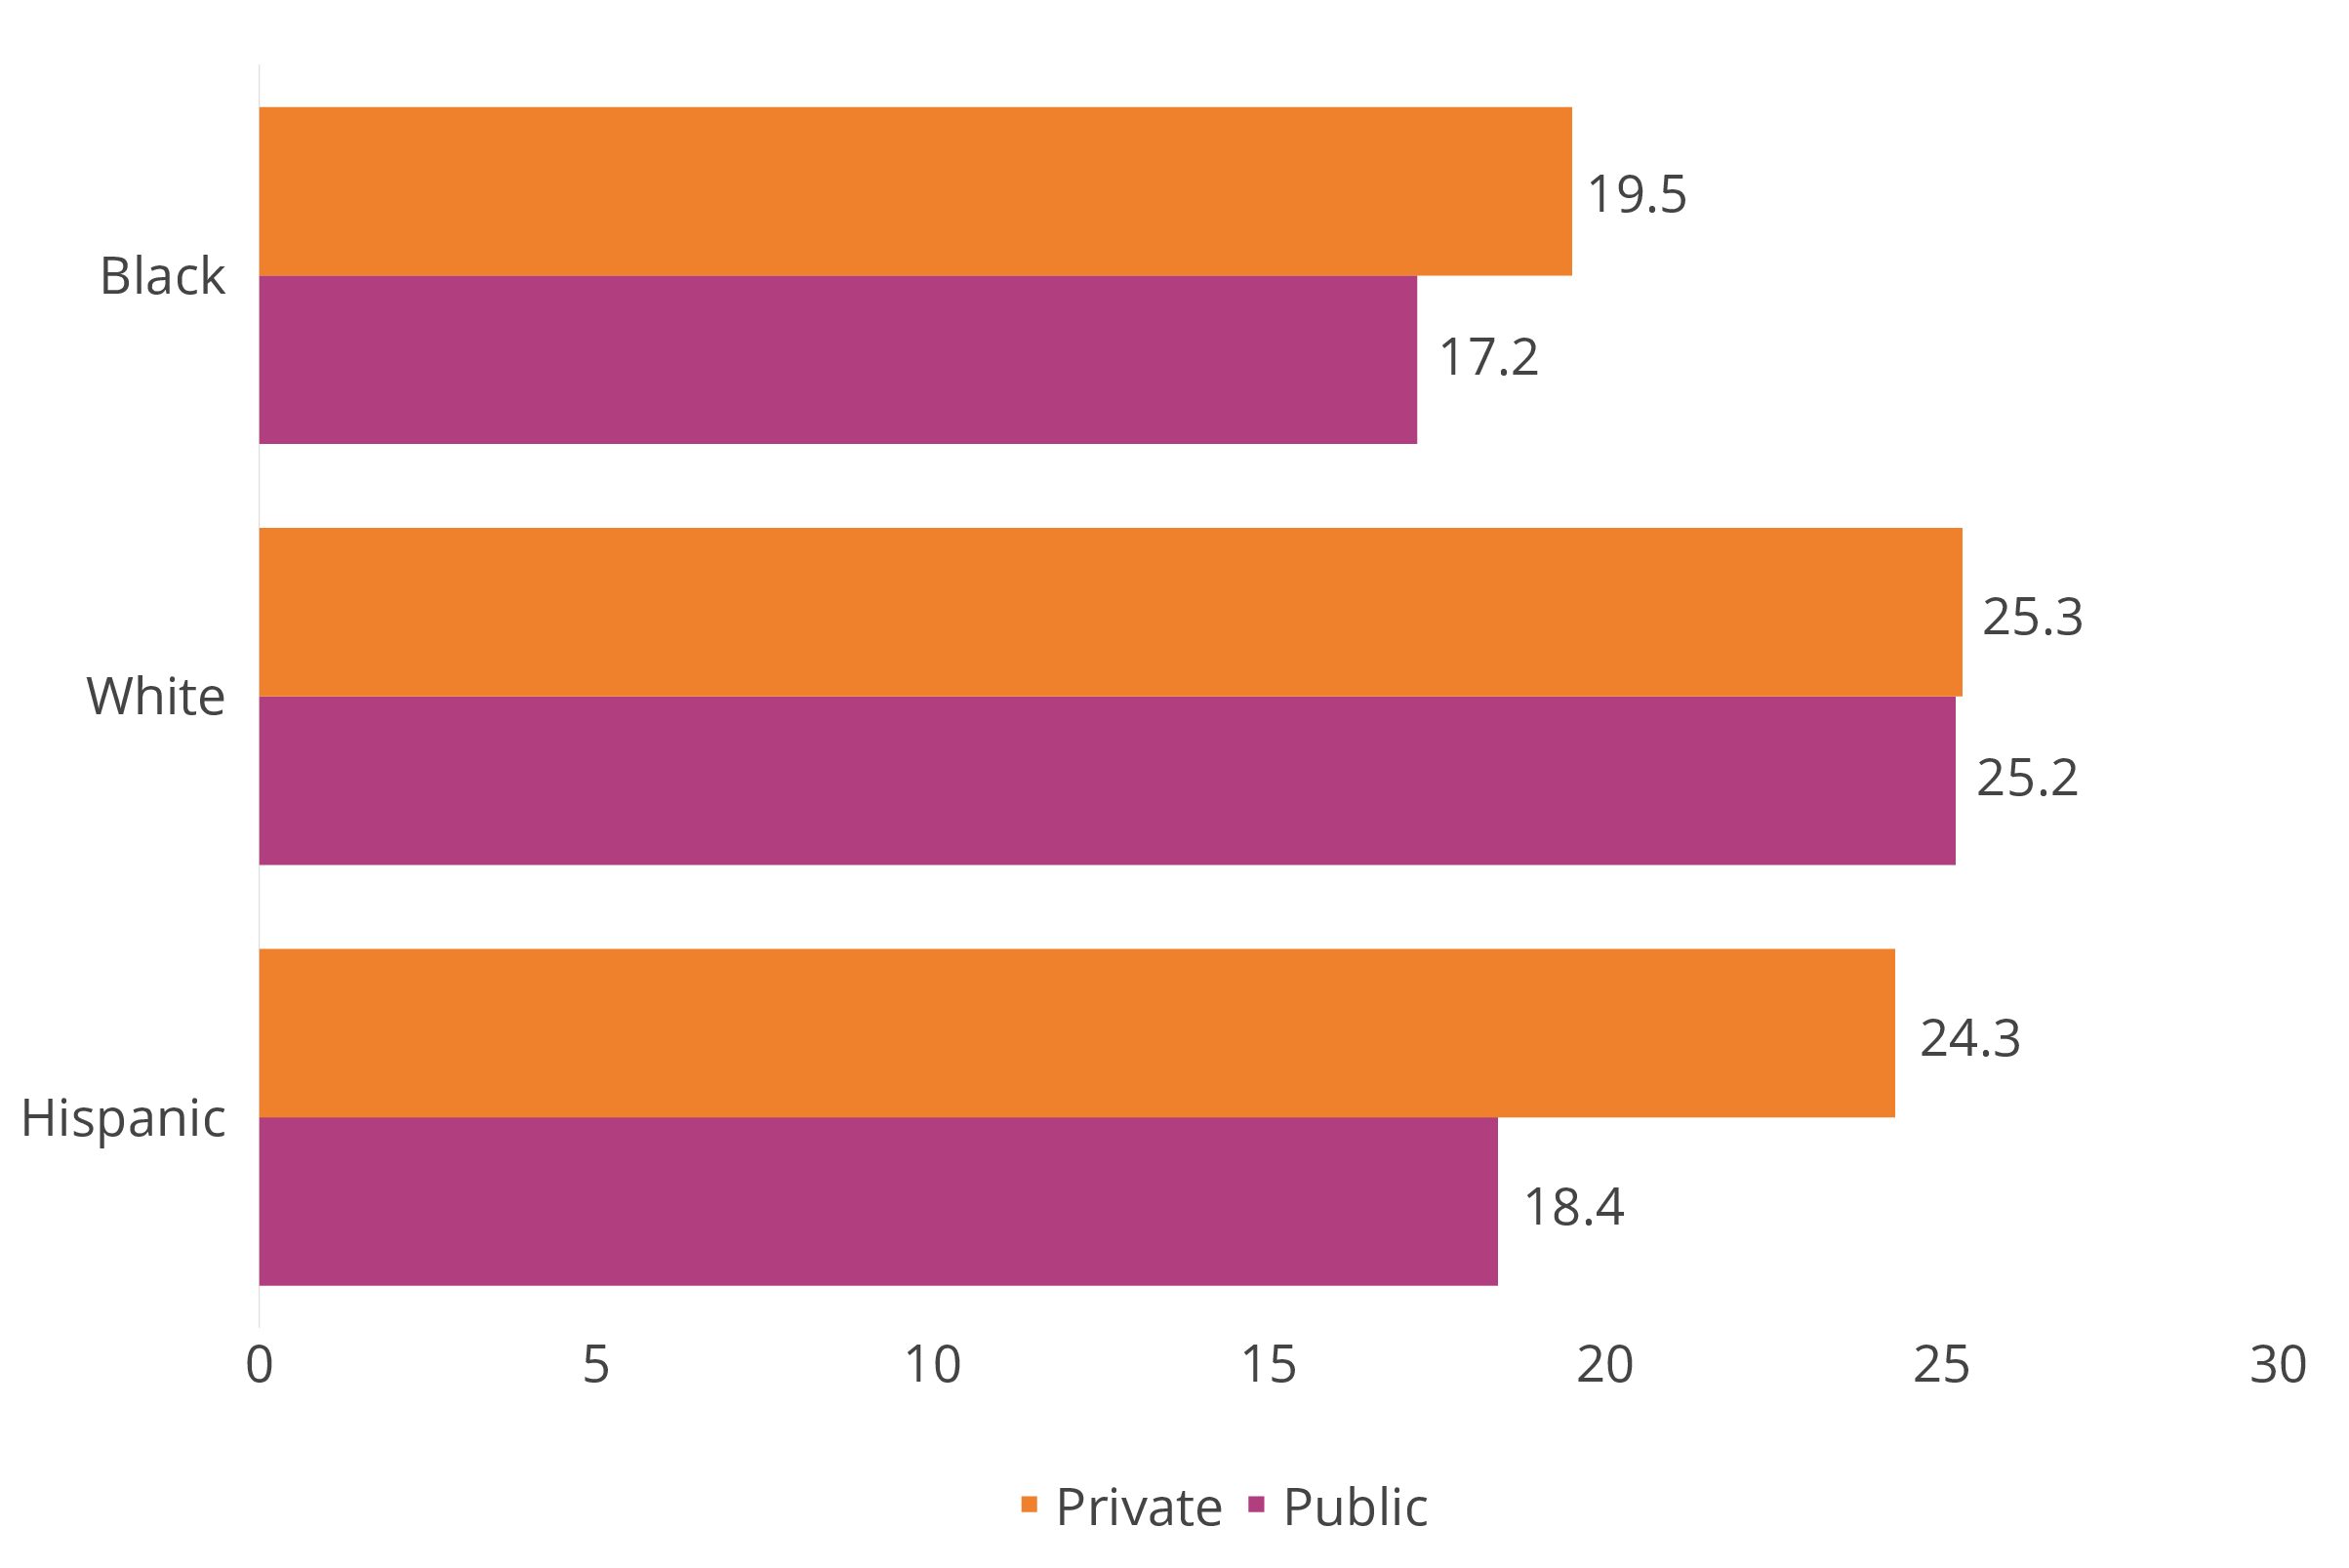
- Roughly a third of all high school students in New Orleans attend private schools and two-thirds attend public schools. Looking across all public and private schools, African Americans graduating in 2017 averaged 17.6 on the ACT. Black students in private schools scored 19.5 on average, while black students in public schools scored 17.2, and Hispanics in public schools scored 18.4. White students in private schools scored 25.3 on average, while white students in public schools scored 25.2.
- The share of New Orleans adults with some college education has grown across groups since 1980. But while more than 85 percent of white women and men have some college education, the same is true for only 55 percent of black women and 42 percent of black men as of 2016.
Criminal Justice
- As recently as 2016, individuals detained in the Orleans Justice Center (or Orleans Parish Prison) were nearly four times more likely to be black than white, even after accounting for New Orleans’ large black population.
Conclusion
Fifty years after the Civil Rights era, the dream of economic inclusion for African American New Orleanians has not been fully realized. To be sure, African Americans are much more likely now to go on to college than they were in 1980, but African Americans in New Orleans are still less likely to have attended college than African Americans nationally. As a “system,” New Orleans’ K-12 education pipeline (both public and private schools) is not preparing many African American students with the skills needed to succeed in college as evidenced by average ACT scores below 20. High incarceration rates may be hampering many black men’s employability, with only 52 percent of black men employed in 2016, down from 63 percent in 1980. But lack of family-sustaining wages may be a disincentive to employment as well, as port jobs have disappeared in recent decades and the tourism sector that grew in its place pays low wages.19 African American New Orleanians have made strides in owning homes since 1970, but the majority remain renters—leaving them in less stable housing. And despite substantial improvements in health insurance coverage and health outcomes, black New Orleanians still experience poorer health—even those who are more educated than whites—implicating bias in health care delivery and the body’s chronic stress response to racism. The policy changes, interventions, and programs since the 1960’s have not been enough to counteract discrimination—much of it unconscious—leading to poor outcomes across a number of systems for African Americans in New Orleans.
While many of these trends are not inconsistent with national trends, on nearly every indicator New Orleans fares worse than the nation. To be sure, New Orleans is not even performing as well as other Southern cities. A forthcoming report from Sage Policy Group calculates that if New Orleans African American households earned income on par with Atlanta’s African American population, incomes would be nearly nine percent higher, and GDP would increase $1.13 billion. If incomes locally equaled Charlotte’s African American population, they would be 23 percent higher, and GDP would increase $3.05 billion.20
Still, New Orleans is in a unique position. Katrina caused a break in the status quo that led to massive citizen engagement, institutional reforms, and data-driven overhauls of policy and planning. There is no doubt New Orleans has increased its civic capacity for problem-solving and innovation since 2005.21 With these new capabilities, New Orleans is better positioned to address the critical unfinished business of economic inclusion going forward.
New Orleans enters its fourth century in an era of rapid change. Changing demographics are ushering in a more diverse workforce. With fast growing African American and Hispanic populations in St. Tammany, Jefferson, and St. Bernard parishes, the challenge of growing an inclusive economy is a regional one. Future workforce shortages will only grow if education and training systems do not effectively prepare our increasingly diverse labor force. While climate change is increasing risks, it is also increasing demand for water management innovations worldwide. The region has potential for increased economic opportunity if water management products and services could be generated by New Orleans entrepreneurs, leveraging their knowledge managing New Orleans’ subsidence and Louisiana’s changing coast.22 Finally, demand for digital skills is escalating. From bank employees, to nurses, to car mechanics, jobs requiring medium and high digital skills have replaced jobs requiring lower skills.23 The metro’s Video Production & Distribution industry has grown from 492 jobs in 2002 to 2,952 jobs in 2014,24 but Greater New Orleans, Inc. estimates that there are more than 16,000 jobs across various industries that require medium or high digital skills.25 The November announcement that DXC will open a major office in New Orleans and eventually employ 2,000 workers means that demand for high digital skills will substantially increase in the city.26
Essential to preparing New Orleans’ workforce for these and other changes will be strategic long-term investments in human capital. Employers need talent. Whether jobs remain unfilled, poorly filled, or subject to turnover, the cost to employers is high.27 Key strategic investments should include funding for public higher education institutions, which are significant engines of economic growth. Public education institutions are best positioned to build broad-based human capital, which regional economies need, not only to fill jobs, but also to support entrepreneurship writ large.28 States have historically been the primary force behind funding higher education.29 Unfortunately, Louisiana has slashed higher education funding nearly in half since 2008.30 New Orleans’ business leaders are already advocating for reinstating state funding for higher education to increase regional competitiveness.
In addition, innovative partnerships, bringing together economic development actors with talent development systems and employers, are hard to execute but more and more critical to meeting employers’ needs.31 New Orleans’ new merger between its public-private New Orleans Business Alliance and the Landrieu Administration’s Network for Economic Opportunity32 can sponsor industry-led trainings that customize skill development to specific labor market demands and connect employers to untapped pools of qualified workers. This will require significant involvement from employers in curriculum development, and expertise from workforce development leaders to nimbly navigate complex government policies and funding streams. Done well, New Orleans could lead the country in developing solutions for this pervasive challenge.
Even when education systems prepare workers well, a lack of workforce housing and adequate transit is a drag on a region’s productive potential. It undermines employers’ ability to find and retain well-matched employees.33 New Orleans’ strategic investments should include housing and transit that link more residents to family-sustaining jobs and increase overall regional productivity.
Barriers to labor market participation due to poor educational opportunities and discriminatory practices leave behind costs borne by the entire economy. Economists calculate that 27 percent of the nation’s increased GDP since the 1960s was due specifically to changes in social norms, greater educational opportunities, and reducing discrimination.34 The indicators in this report point to evidence of unconscious bias at work in schools, criminal justice, health care, and likely employment in New Orleans. Leaders in each area can educate themselves about common barriers, norms, and preconceptions that lead to inequitable outcomes, and devise policies and practices to reduce inequities within their spheres of influence.
Finally, economic exclusion is and has always been fiscally costly. Fully 24 percent of all New Orleans’ tax dollars35 and 63 percent of the City’s general fund went to public safety costs in 2017.36 A stronger focus on growing an inclusive economy will be important for reducing these costs and redirecting public spending toward pressing priorities such as infrastructure, education, and innovative public amenities.
Historically, New Orleans’ greater tolerance of diversity yielded cultural expressions that became world renowned. Going forward, New Orleans must be more intentional about embracing diversity to sustainably grow regional prosperity. This will require being clear eyed about existing racial and ethnic divisions, and developing innovative new policies and practices that put the region on a solid path toward an inclusive economy. Leaders in all sectors, not just economic development, can examine their own impact on minority communities, and consider how they may be contributing to these disparities—thinking “outside the box” about how to turn them around. New leadership in City Hall should extend current initiatives that are working and augment them with new ones that promote inclusive growth. In addition, the new Mayor can use the bully pulpit to further a vision for the city that embraces its diversity and catalyzes action by the private sector. The Tricentennial provides a unique moment in history for New Orleans to set a course for the future that truly grows broad-based prosperity, expands the city’s resilience, and inspires an increasingly diverse nation.
Employment and Income
- Median Household Income
- Median Household Income by Race and Ethnicity
- Income Inequality by Race and Ethnicity
- Employment Rates by Race, Ethnicity, and Gender
- Households Earning Below Living Wage by Race and Ethnicity
- Child Poverty by Race and Ethnicity
- Industry Employment and Wages, Specialized Traded Clusters
- Industry Employment and Wages, Local-serving Clusters
- Minority-Owned Businesses
-
WHY IS THIS IMPORTANT?
Household income is a basic measure of the extent to which a household can provide for itself and build wealth. Household income growth is an important measure of increasing family well-being but is also key to driving overall economic growth, boosting tax bases, and supporting local businesses.
HOW ARE METRO NEW ORLEANS AND NEW ORLEANS DOING?
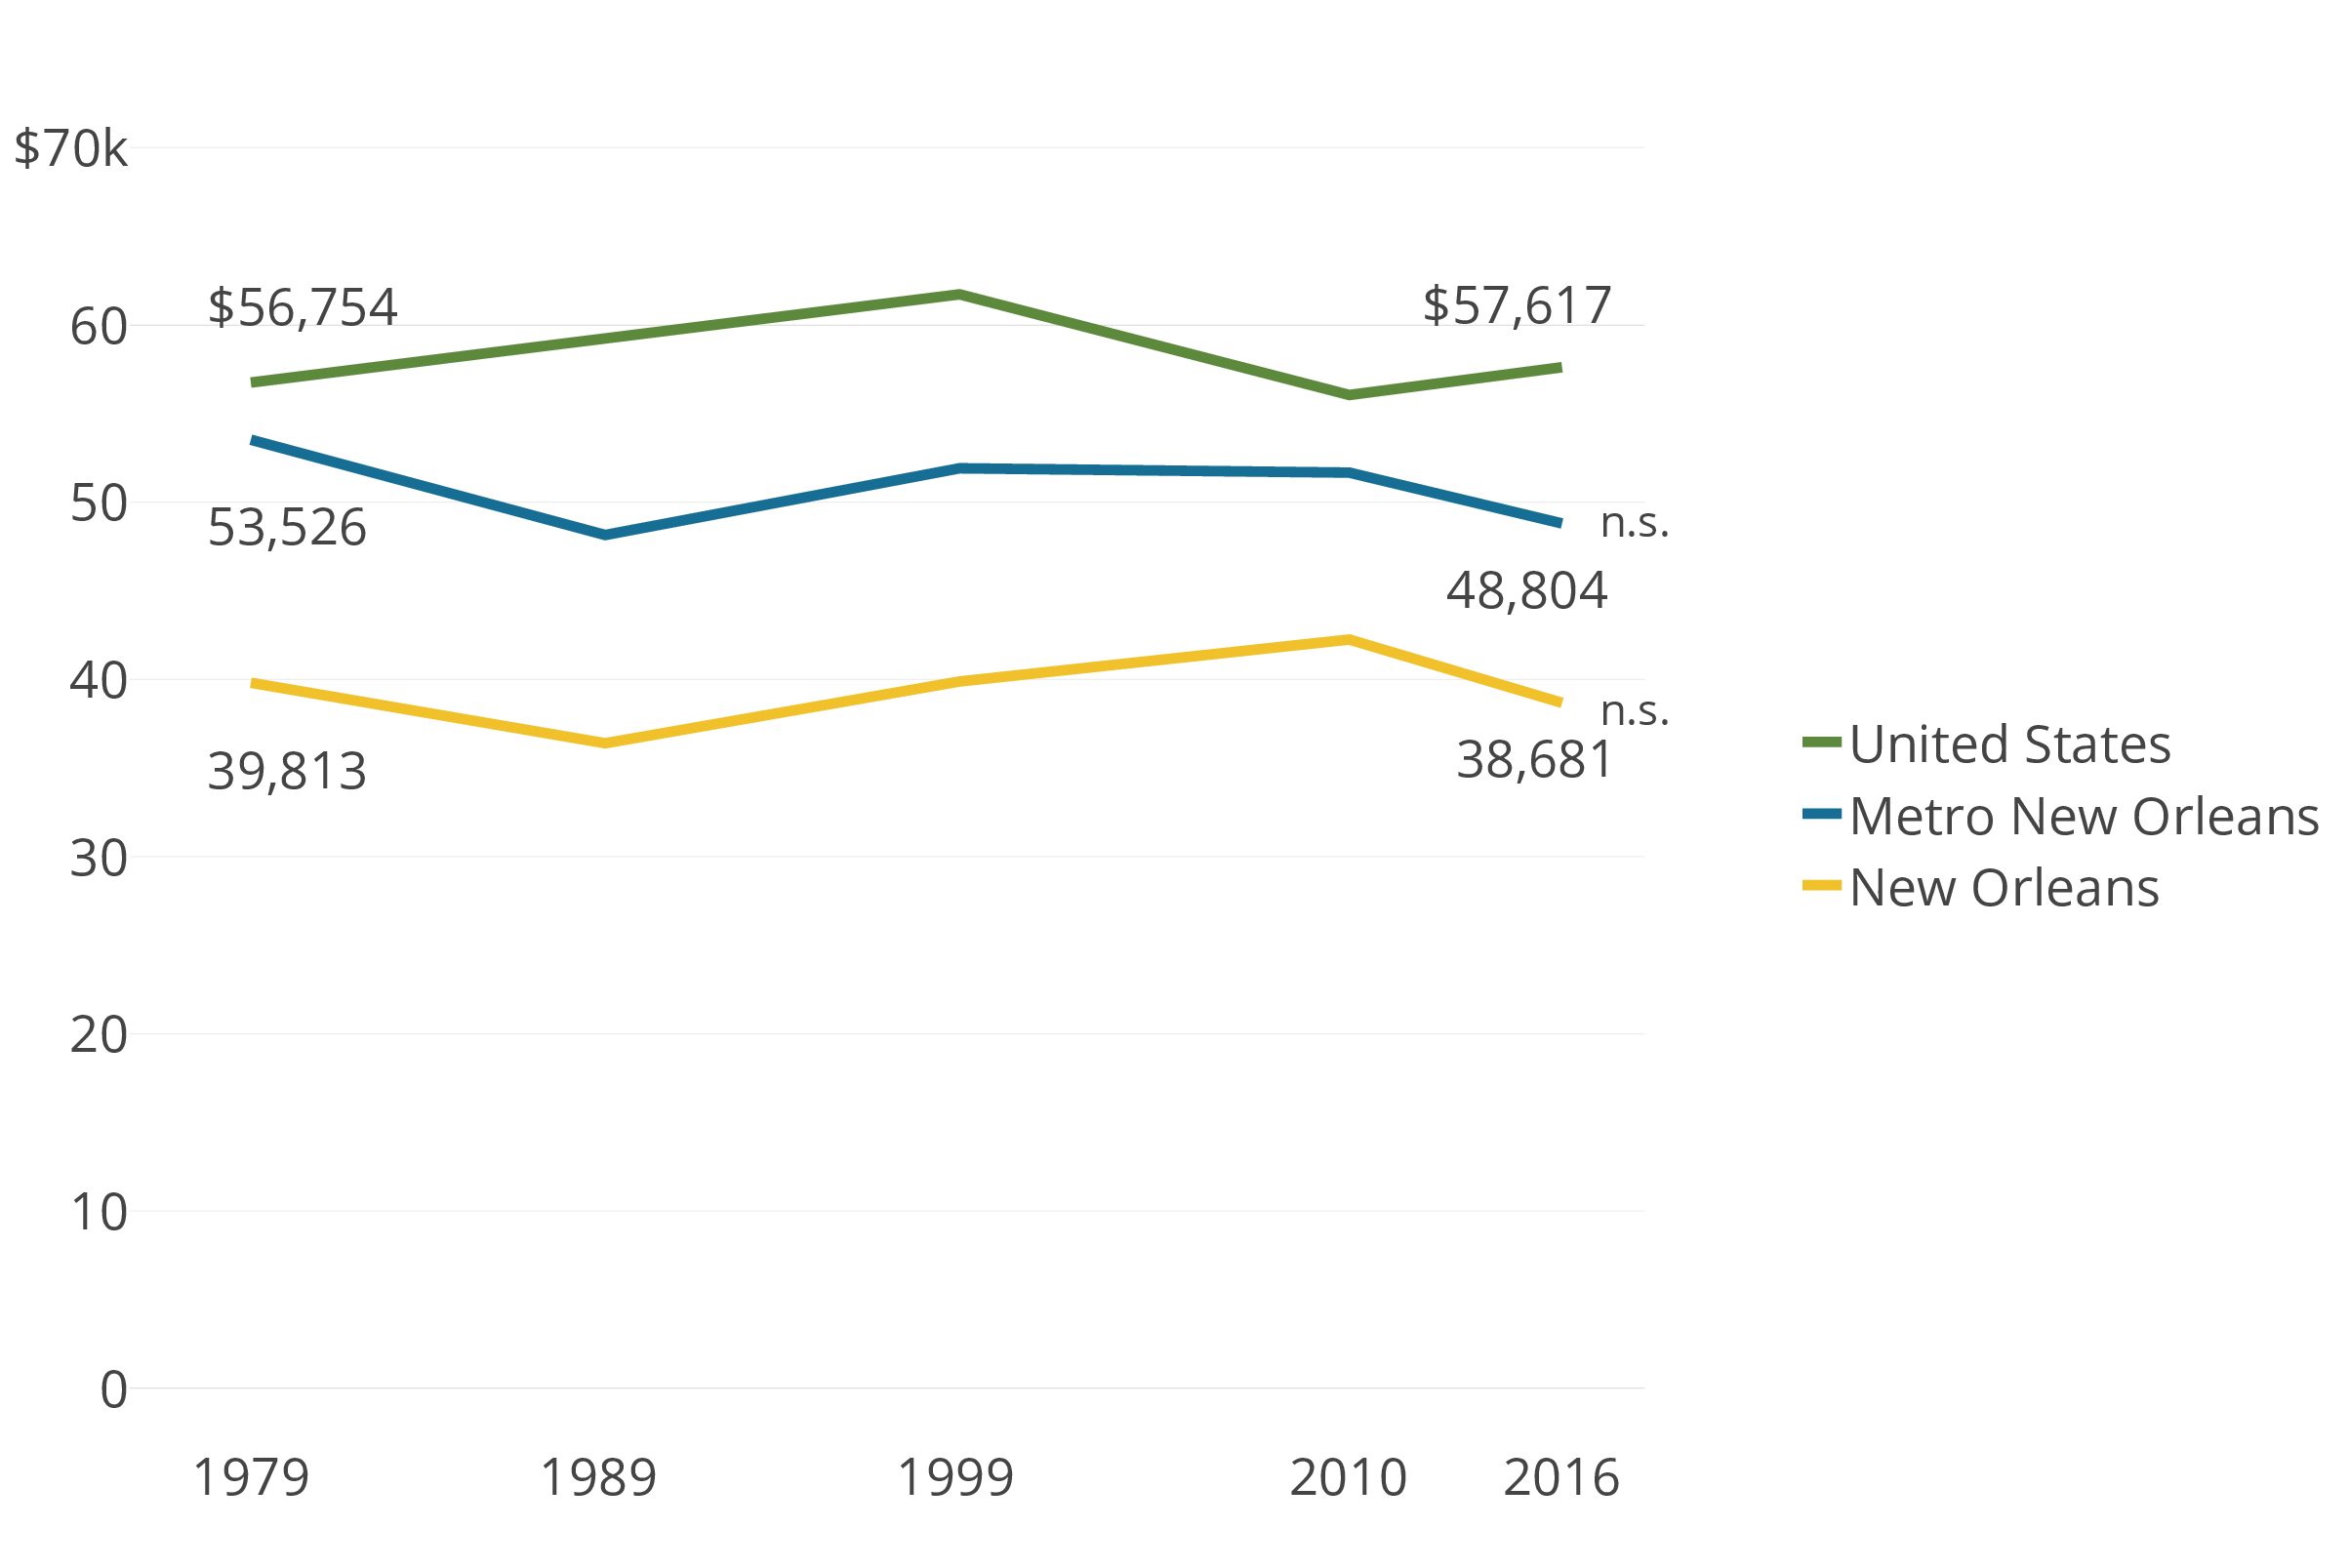
Since 1979, median household income has grown only 2 percent nationwide after adjusting for inflation, but metro New Orleans has fared far worse over the same time frame, with incomes falling 9 percent. Since Katrina, much focus has been placed on the strength of metro New Orleans’ economy relative to the nation. Indeed, while the Great Recession pushed household income down 9 percent nationwide between 1999 and 2010, the median income in metro New Orleans held steady. But since 2010, though incomes nationally have rebounded slightly from $56,052 to $57,617 in 2016, incomes in metro New Orleans have fallen from $51,670 to $48,804. Metro New Orleans has historically had lower incomes than the nation, although the extent of the gap has grown since 1979.
The median household income in metro New Orleans was only 6 percent lower than the national average in 1979 but fell to 19 percent lower after the oil bust of the 1980s.The metro has experienced some recovery since the oil bust, but in 2016, metro New Orleans’ incomes are still 15 percent lower than the nation. Residents of the city of New Orleans have incomes 33 percent lower than the national average. Fully half the city’s households earn less than $38,681.

Source: U.S. Census Bureau.
n.s = Difference is not significant for New Orleans for 1999-2010, 1999-2016, and 2010-2016.
n.s = Difference between 1999 and 2010 is not significant for New Orleans Metro.
-
WHY IS THIS IMPORTANT?
Household income by race and ethnicity is important in demonstrating the extent to which income gains and economic growth are broadly shared and becomes more critical to long-term economic prosperity as a region becomes “majority minority.”
HOW IS METRO NEW ORLEANS DOING?
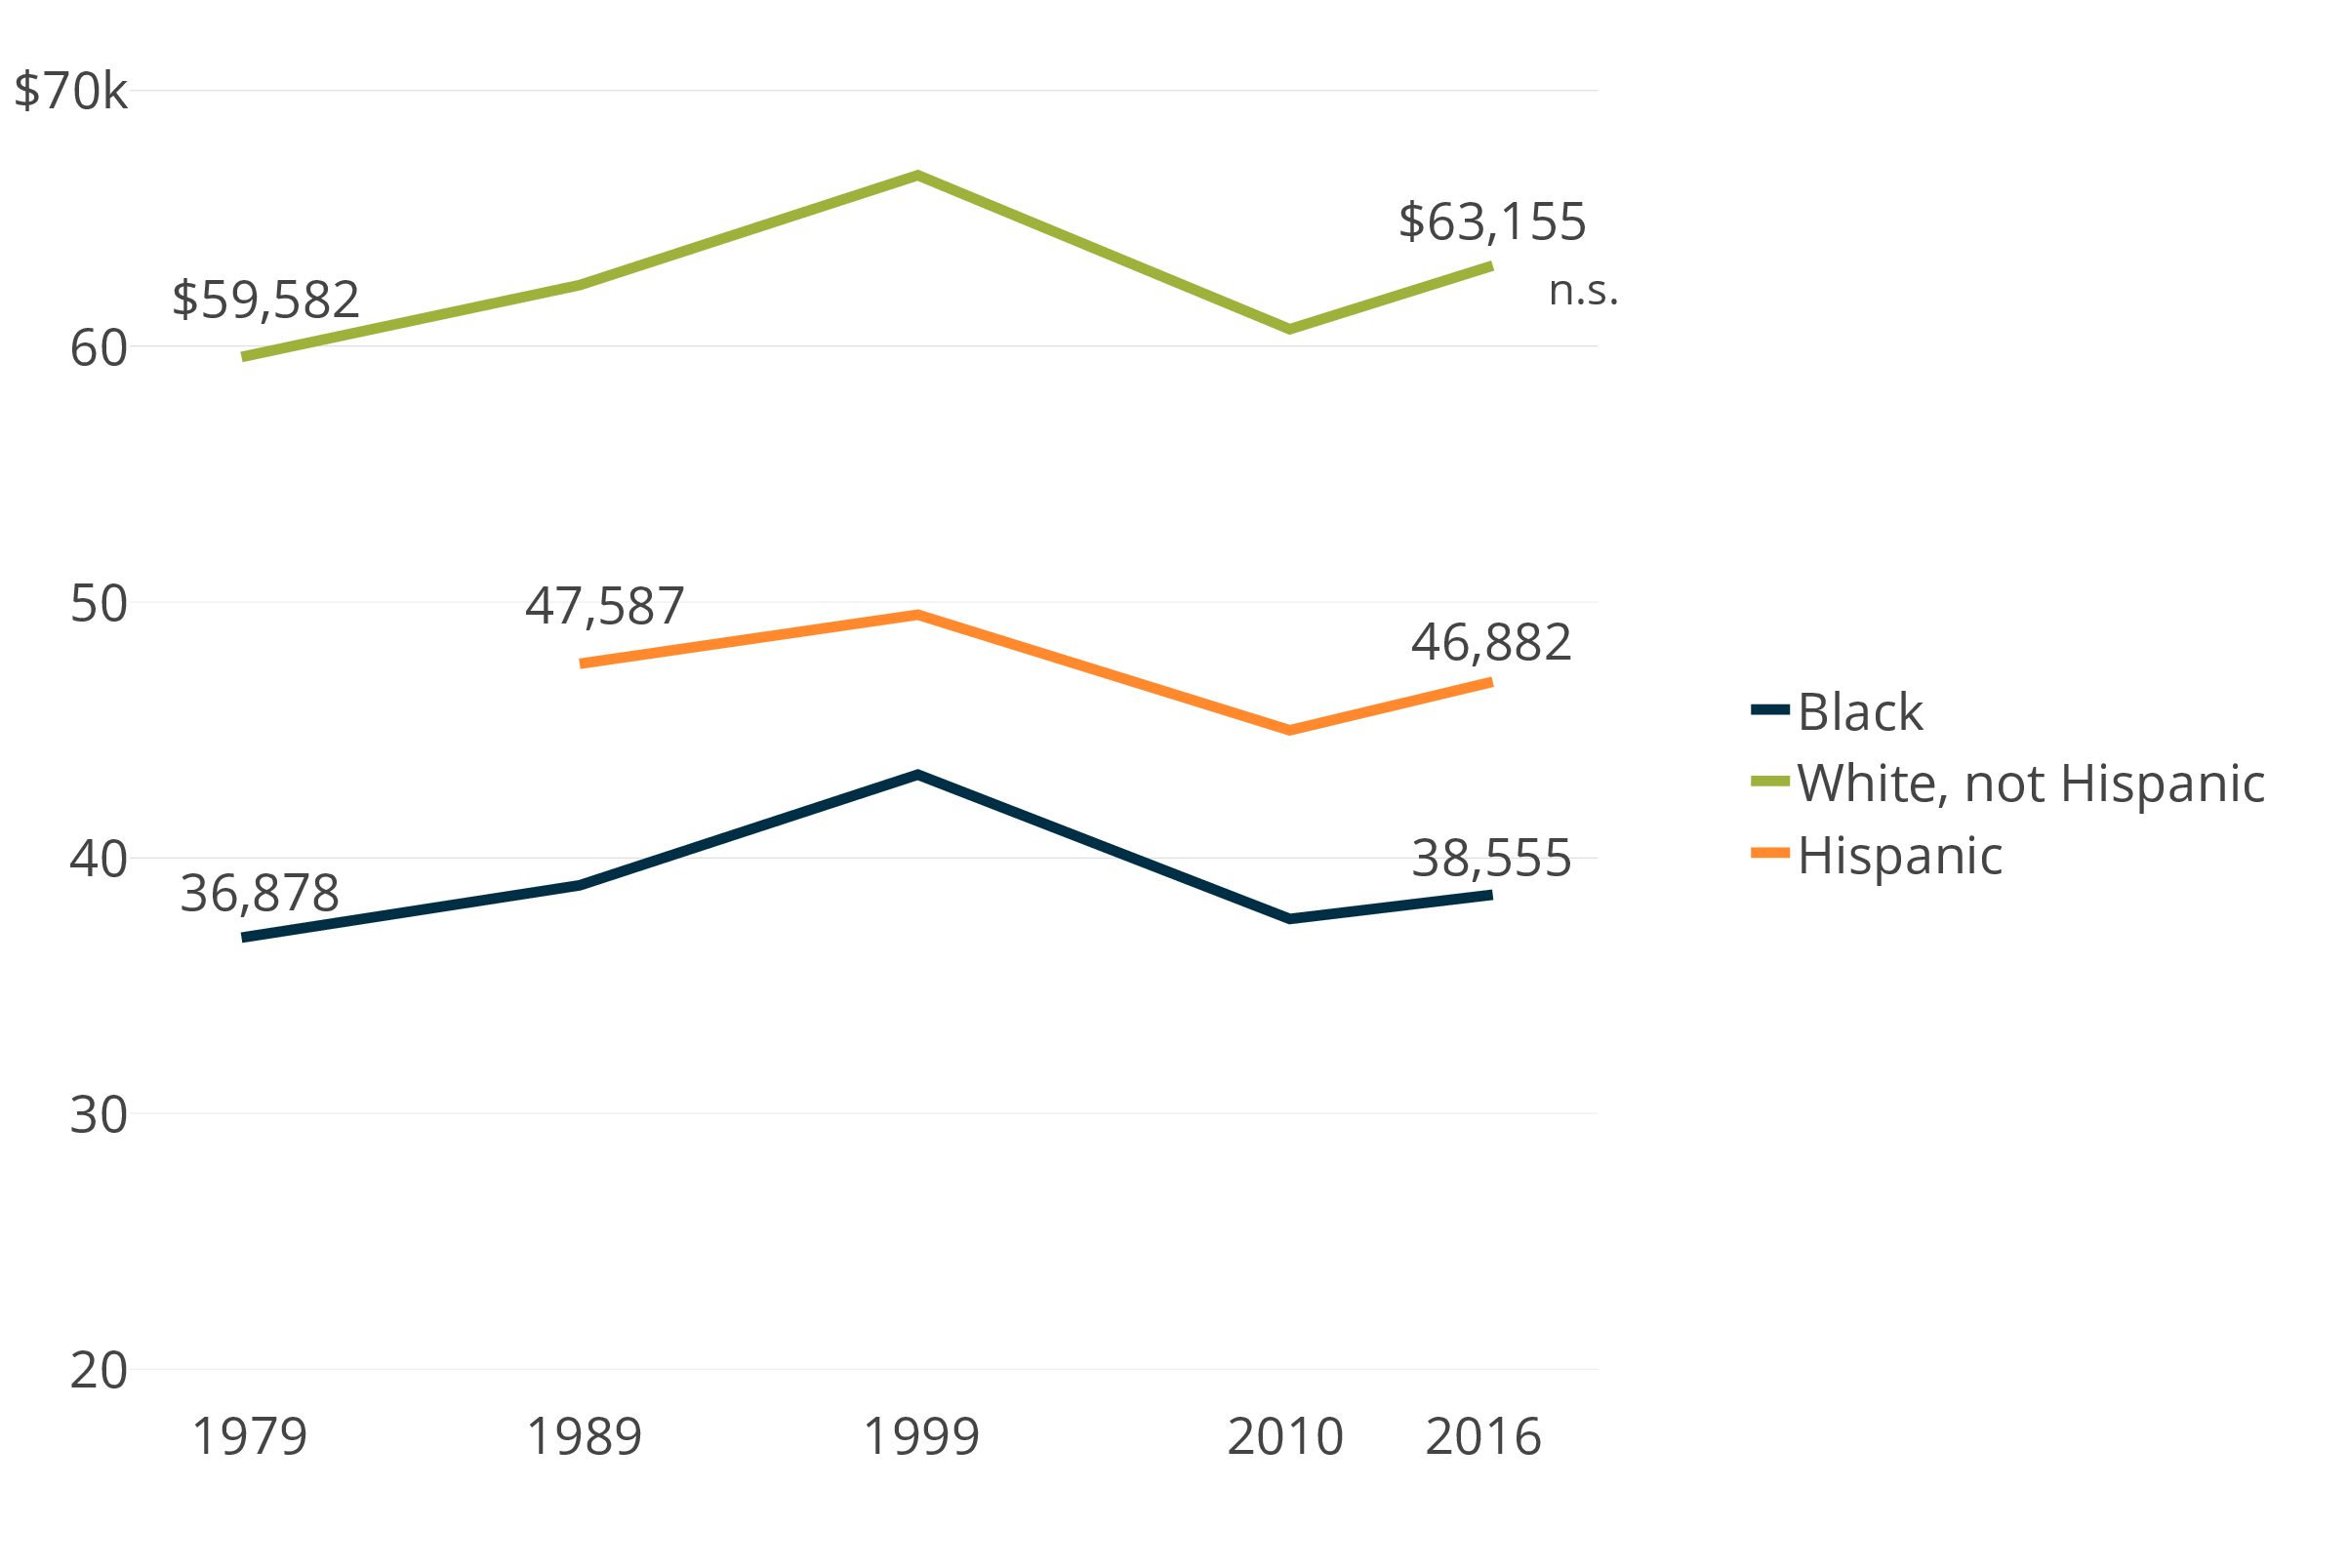
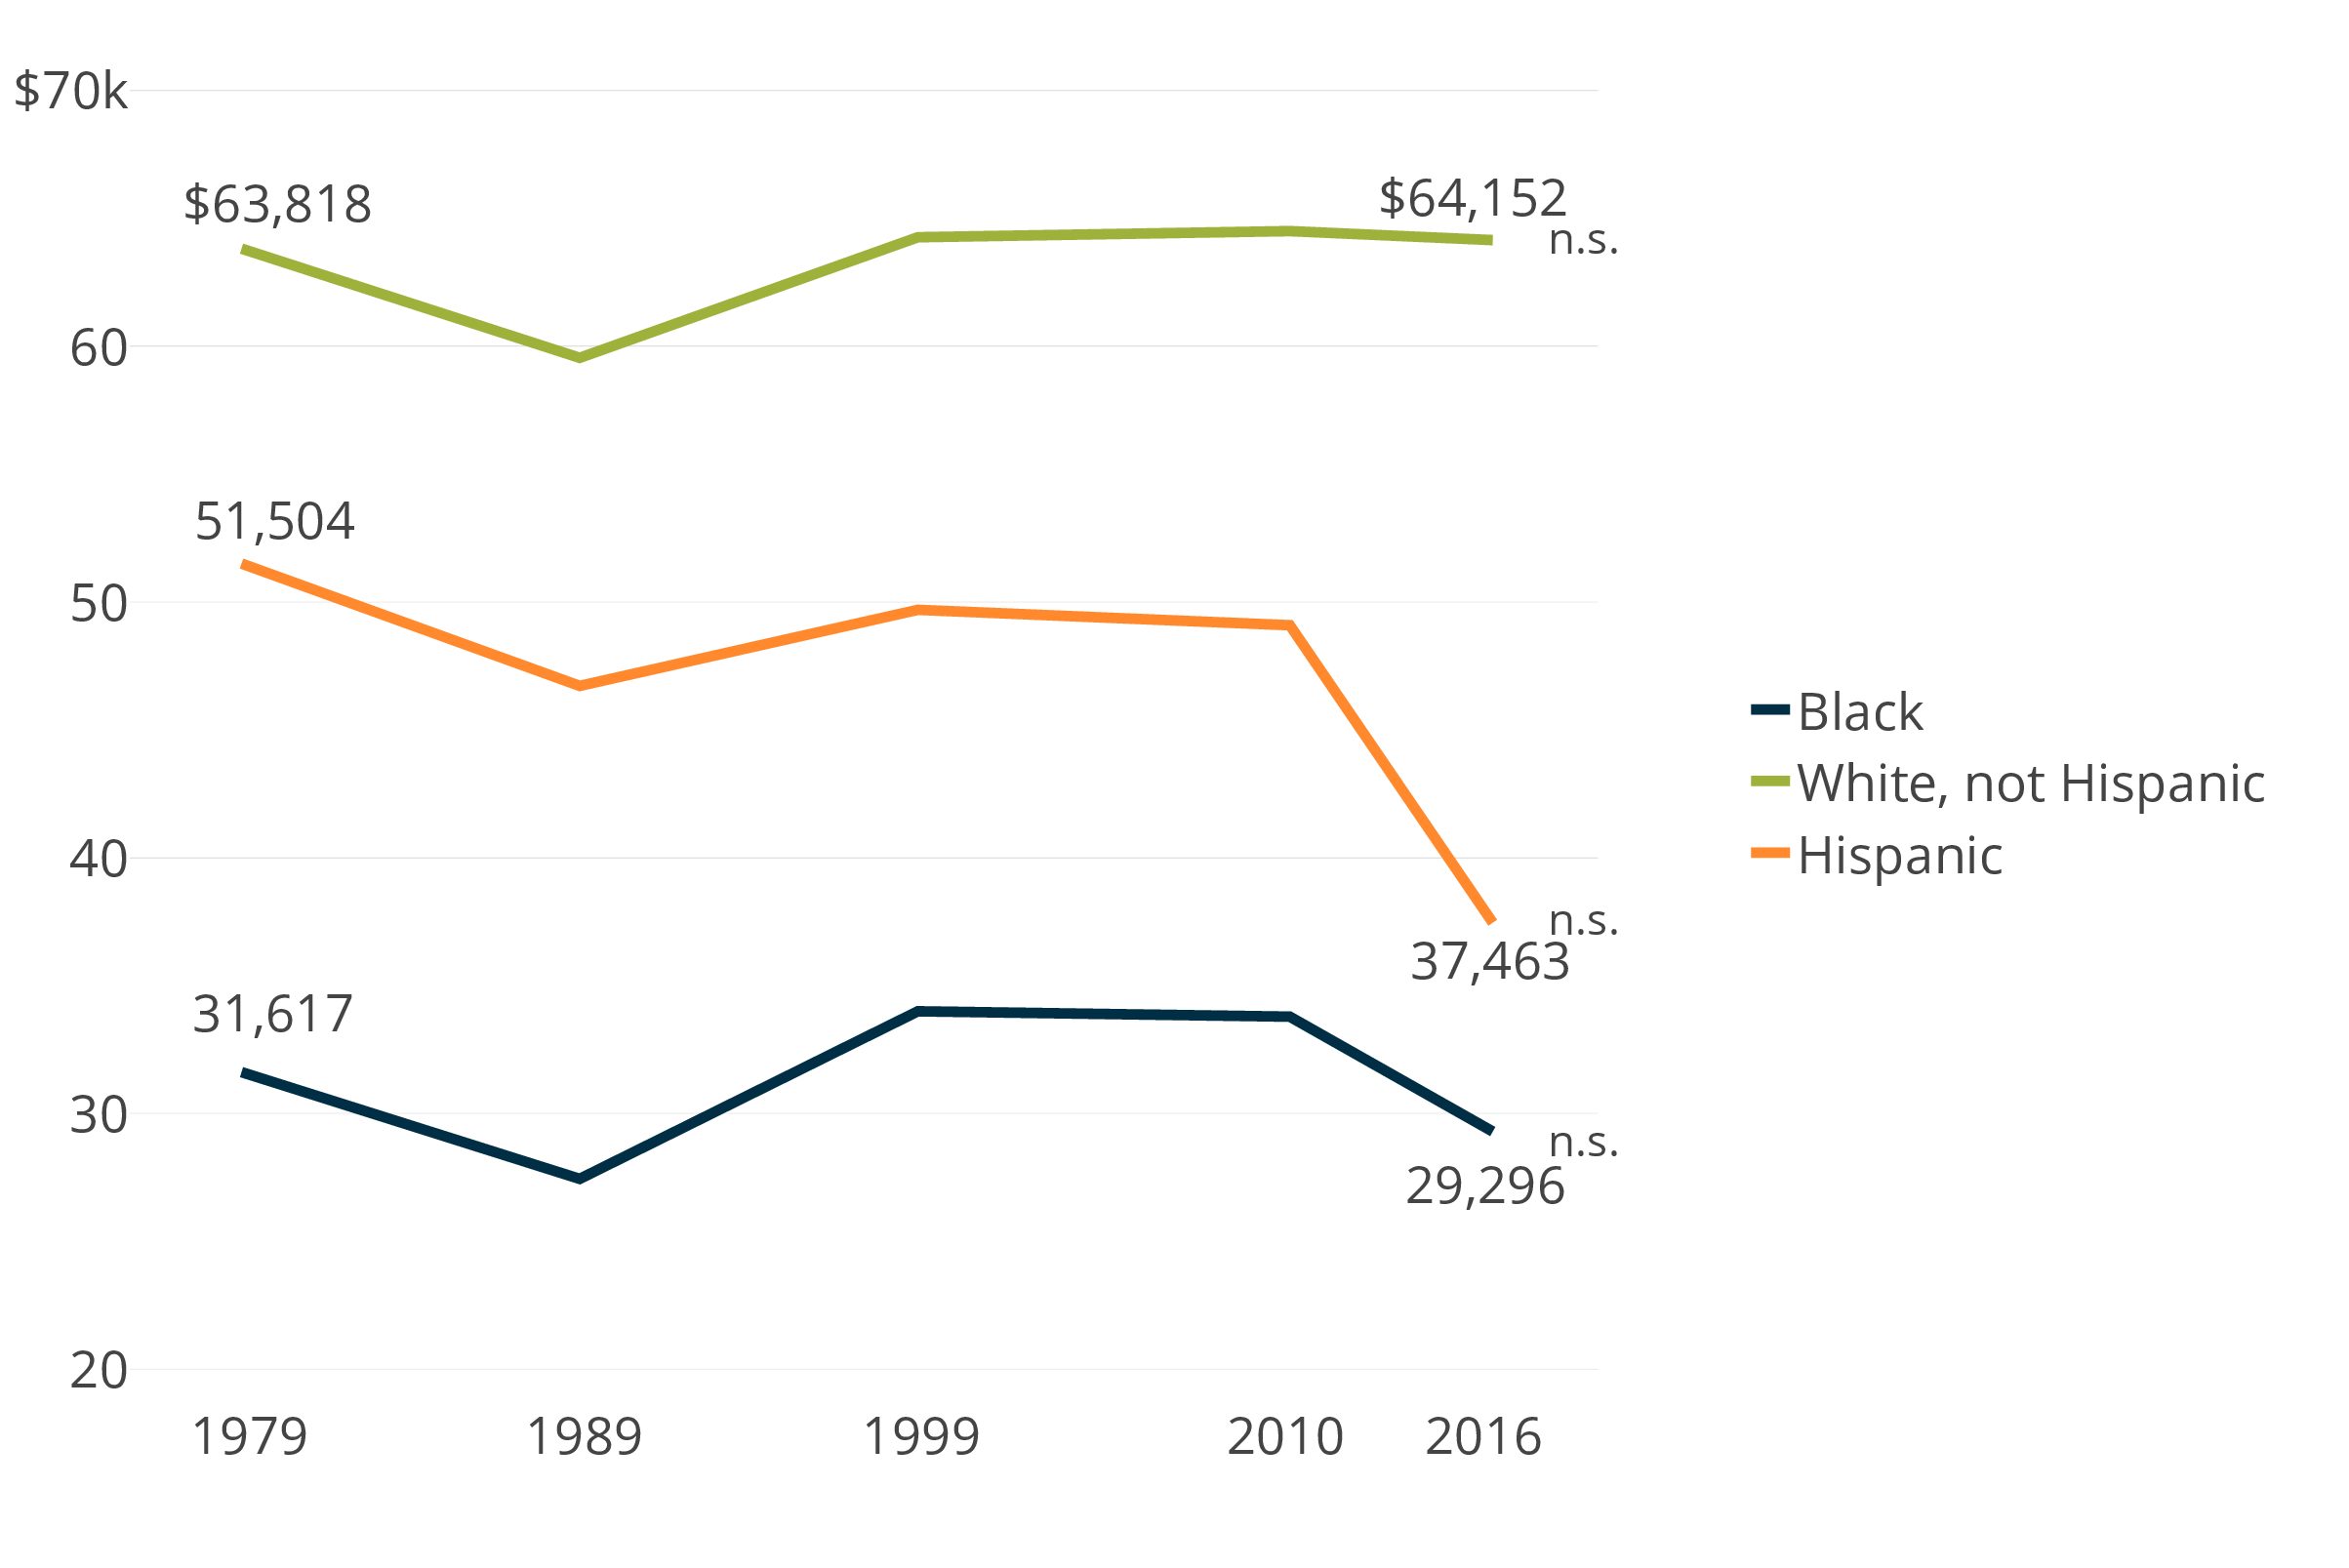
Racial differences in income are not unique to metro New Orleans, but the distribution of incomes in metro New Orleans follow a more extreme pattern with black and Hispanic households accounting for nearly all of the regional income losses since 1979. Since 1979, white household income grew 6 percent nationally and black income grew 5 percent. Over the same time period, in metro New Orleans, white income has mostly held steady while black incomes have fallen 7 percent after adjusting for inflation. In contrast to the nation, where the patterns of income loss and rebound following the Great Recession are more consistent across racial/ethnic groups, in metro New Orleans, the recent declines in income have been almost exclusively borne by black and Hispanic households. From 1999 to 2016, the median income for white households in metro New Orleans held steady while the median income for black households fell 14 percent and the median income for Hispanics fell 25 percent (although the large margin of error makes the 2016 Hispanic income estimate less reliable). In 2016, while white households in metro New Orleans earn incomes that are on par with their national peers, the median income for black households in metro New Orleans, at $29,296, is 24 percent lower than for black households nationwide. African American households in metro New Orleans earn 54 percent less than white households compared to a national disparity of 39 percent.
HOW IS NEW ORLEANS DOING?
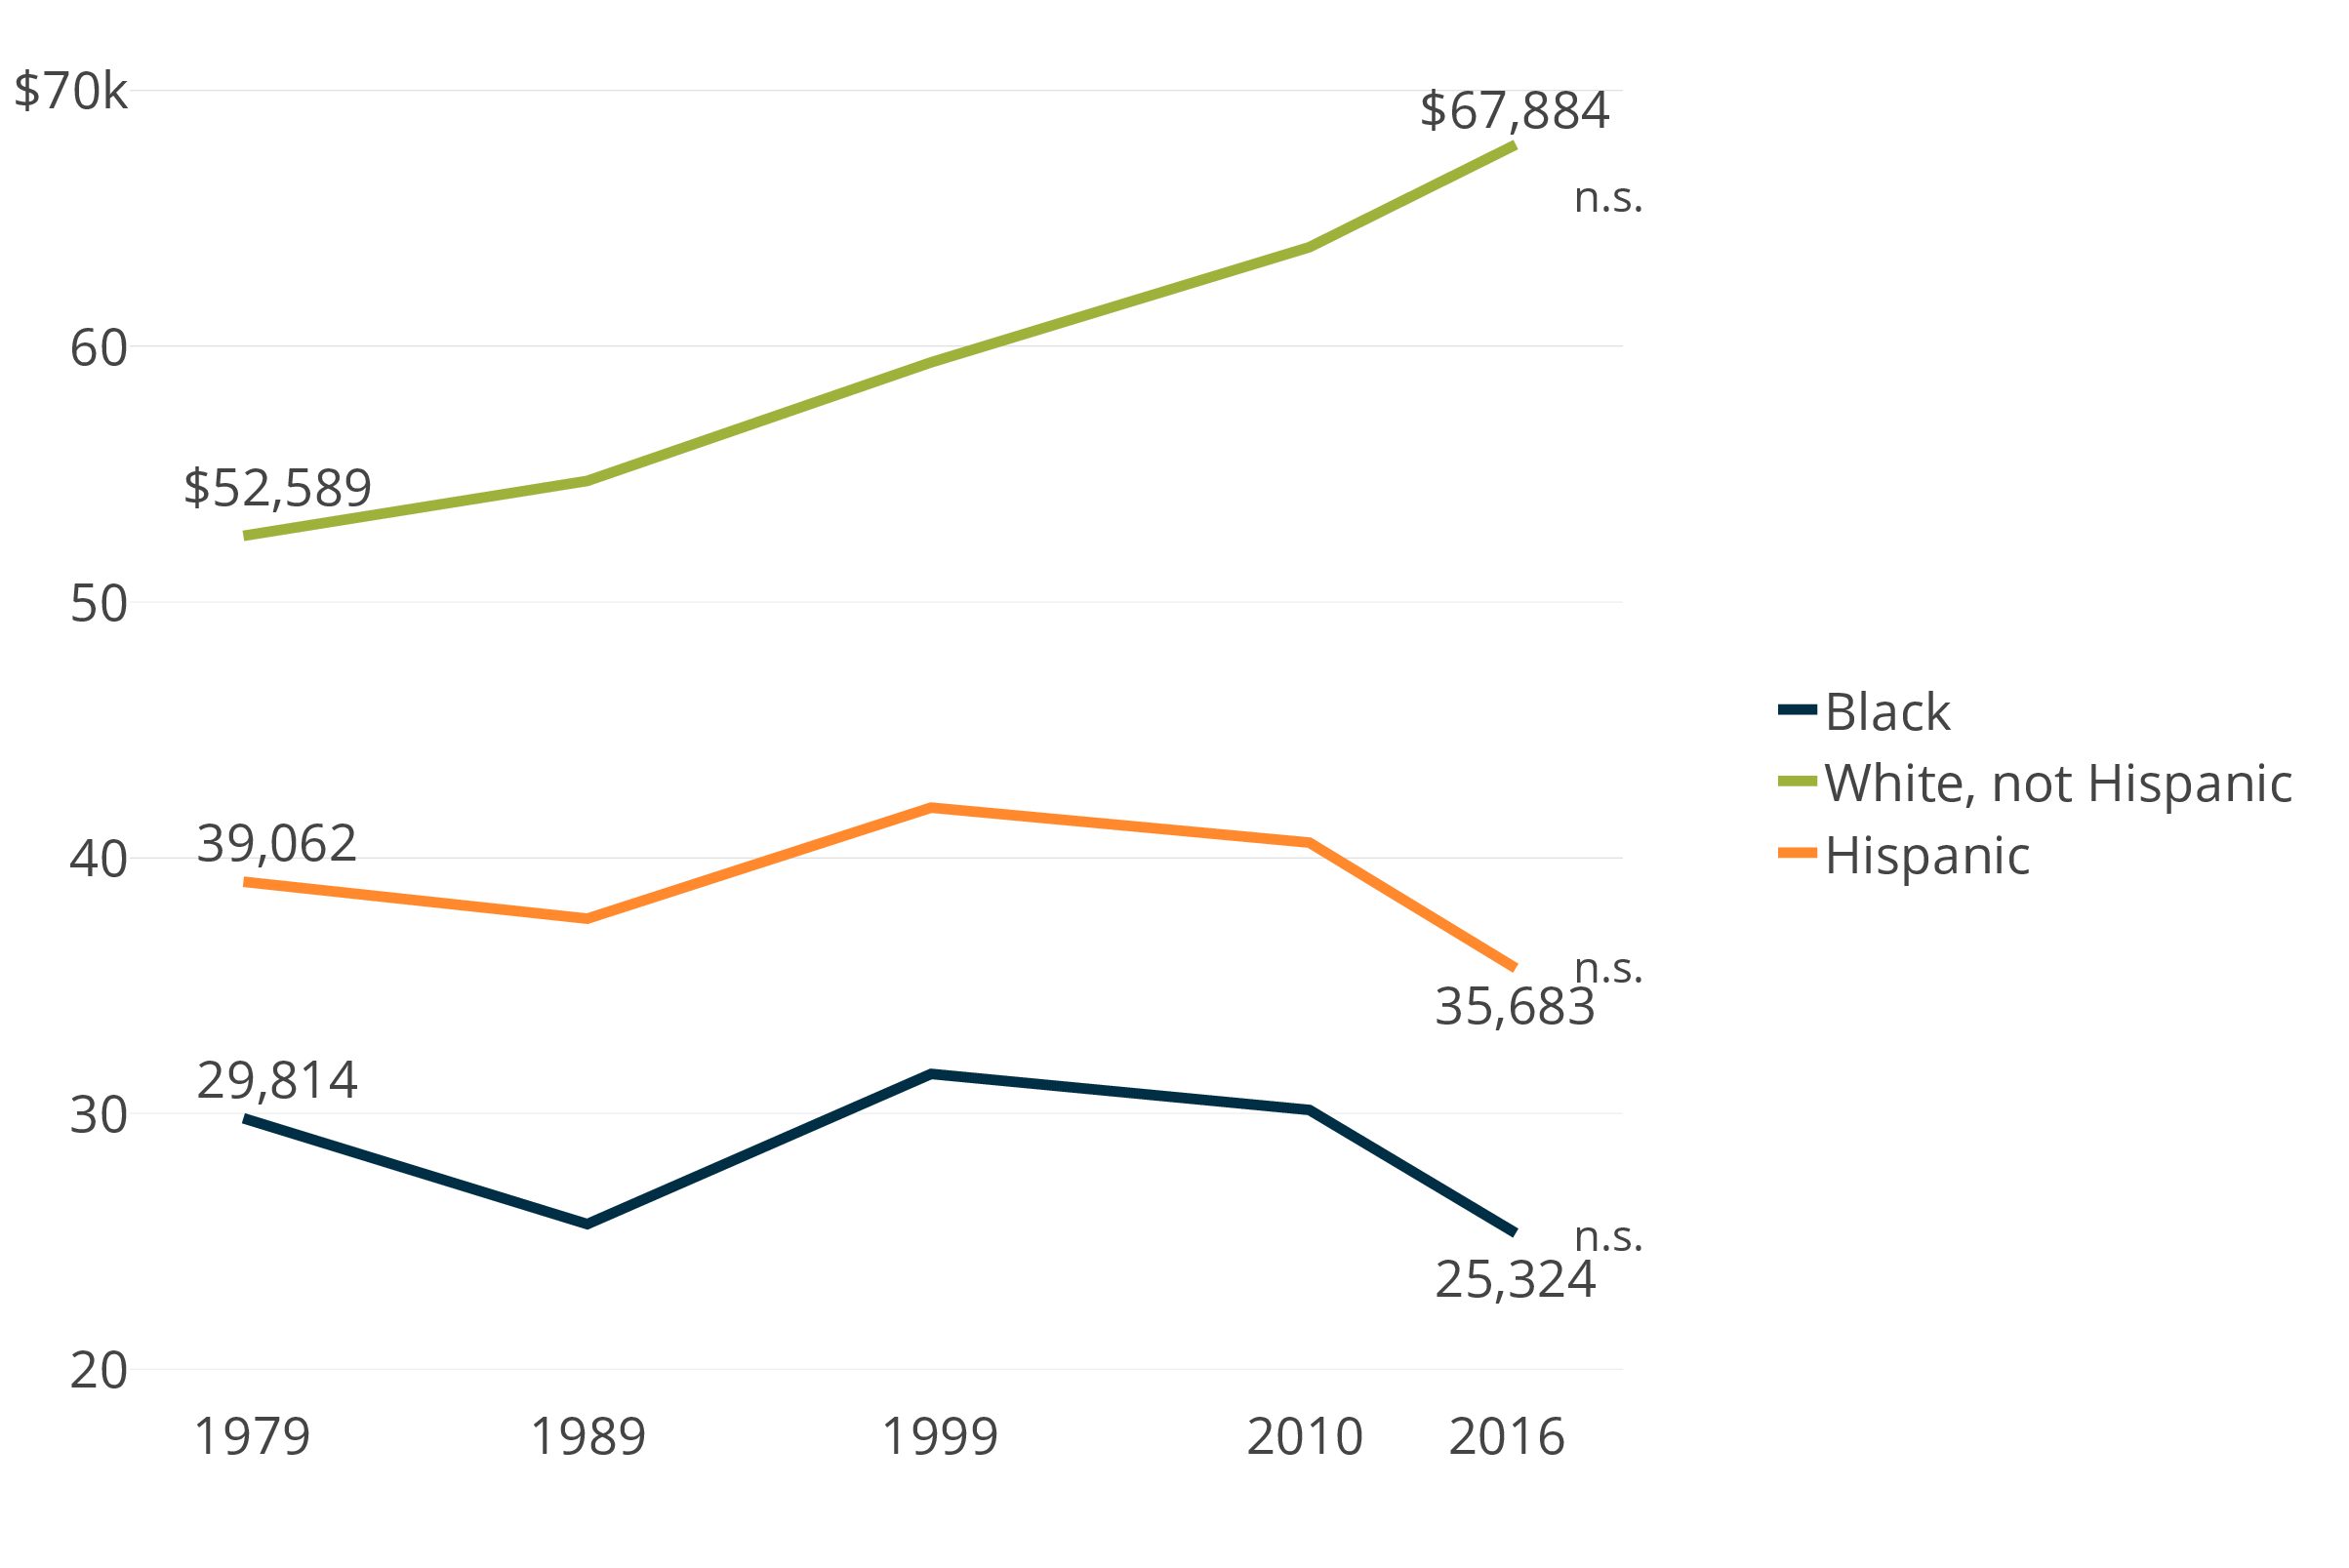
Comparing the median household income in New Orleans to the metro area as a whole, it is apparent that, in 1979, households with higher incomes were disproportionately in the parishes surrounding New Orleans rather than in the city itself. Lower income whites, Hispanics, and blacks were, on the other hand, more likely to live in the city in 1979. By 2016, these patterns have changed. While higher income black households continue to be more likely to live in the suburbs, higher income white households are equally likely to be living in the city as the suburbs. In addition, the real income losses suffered by the metro’s black households since 2010 are being disproportionately felt by households in the city. The result has been that income disparity within the city has escalated. In 2016, black households living in the city of New Orleans earned 63 percent less than white households in New Orleans, and Hispanic households earned 47 percent less. In 2016, blacks in New Orleans had a median household income of only $25,324, while Hispanics were at $35,683 and white households living in New Orleans had a median income of $67,884.


Source: U.S. Census Bureau.
Notes: 1979 data for whites is inclusive of Hispanics (due to data source limitations).
n.s = not statistically significant at the .95 confidence level. See technical notes on pages 58-59 of the report for more details.
-
WHY IS THIS IMPORTANT?
Income inequality can have many adverse effects on a city. Income inequality encourages out-migration of the middle class, in part because a rising real estate market may fail to produce housing accessible to middle-class families. As a result, those who move up the income ladder may move out of the city to find more value for their money, those who move down the income ladder may move out because they cannot afford the higher cost of housing. Unequal cities also tend to neglect essential services because of a narrow tax base, insufficient for sustainably raising needed revenues.1 This sophisticated quintile analysis examines the balance of households across the national income spectrum (divided into five equal categories, or “quintiles”).2 If the city’s income spectrum were on par with the nation, each of the numbers in this analysis would be 20 percent. Differences in the distribution of white and nonwhite households across the income spectrum may reveal disparities that can hamper community cohesiveness and prevent all residents from contributing to prosperity.
HOW IS NEW ORLEANS DOING?
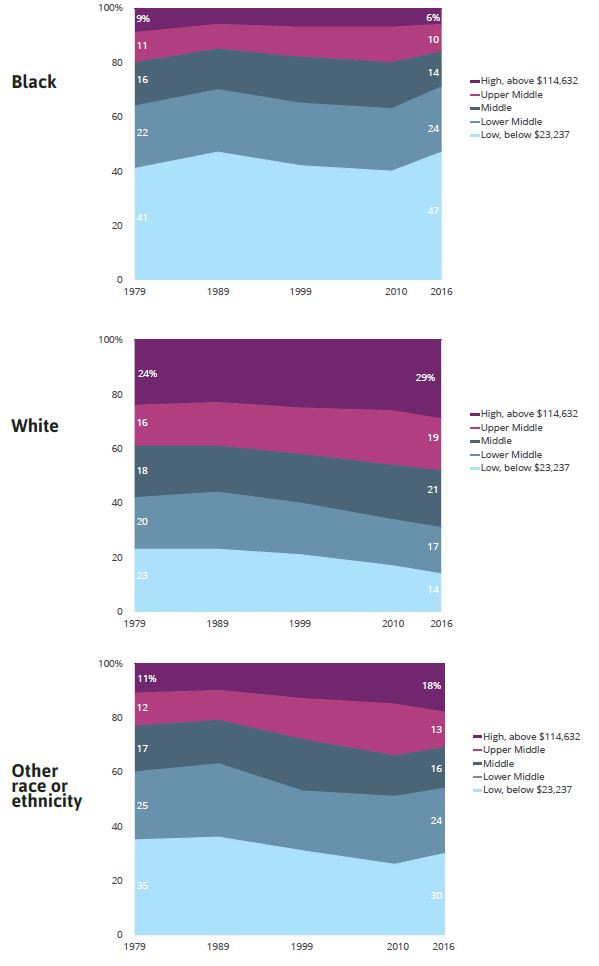
In 2016, while nearly a third of New Orleans’ white households earned over $114,632, only 6 percent of black households earned that much, nearly a five-fold difference. On the lower end of the spectrum, nearly half of all black households (47 percent), but only 14 percent of white households, earned less than $23,237 in New Orleans in 2016.
In 1979, 9 percent of the black households in New Orleans earned in the highest national income quintile, while 41 percent earned in the lowest income quintile. The oil bust of the 1980s took its toll and the share of black households in the highest income quintile shrunk to 6 percent while the share in the lowest income quintile grew to 47 percent by 1989. Since then, African American households experienced some improvement in their household incomes, but by 2016, those improvements have been eliminated and the distribution of African American incomes in 2016 is virtually identical to what it was in 1989 at the end of the oil bust.
White households in New Orleans have fared much better. In 1979, the distribution of households in New Orleans was relatively close to the distributions of incomes nationwide, with 24 percent earning in the top income tier and 23 percent earning in the lowest income tier. When the oil bust hit, a small number of upper income white households either moved out or fell into the middle class as evidenced by a small decrease in the share of white households in the highest income tier to 23 percent by 1989. But the share of white households in the highest income tier living in New Orleans has grown steadily since then, reaching 29 percent by 2016, while those in the lowest income tier have shrunk considerably down to 14 percent, and the distribution of white incomes in New Orleans is now notably better than the national average.

Source: U.S. Census Bureau, IPUMS USA, and HUD.
Notes: National income quintiles were adjusted to reflect cost of living differences in New Orleans. See technical notes for more details on the methodology. High: above $114,632; Upper-middle: $71,154–$114,632; Middle: $44,555–$71,153; Lowermiddle: $23,237-$44,554; Lower: below $23,237. 1979 and 1989 data for whites is inclusive of Hispanics, and thus the “other” category for those years does not include Hispanics who identify themselves as white.
-
WHY IS THIS IMPORTANT?
Employment rates indicate the percent of the working age population that did any work for pay, including self-employment. Employment rates are a more comprehensive measure of labor market conditions than official “unemployment” rates, because they not only reveal the share of the population that are unemployed but also those who are no longer in the labor force at all—many of whom are “discouraged workers.”3 Employment rates by race and gender suggest the extent to which structural economic changes have benefited different groups.
HOW ARE METRO NEW ORLEANS AND NEW ORLEANS DOING?
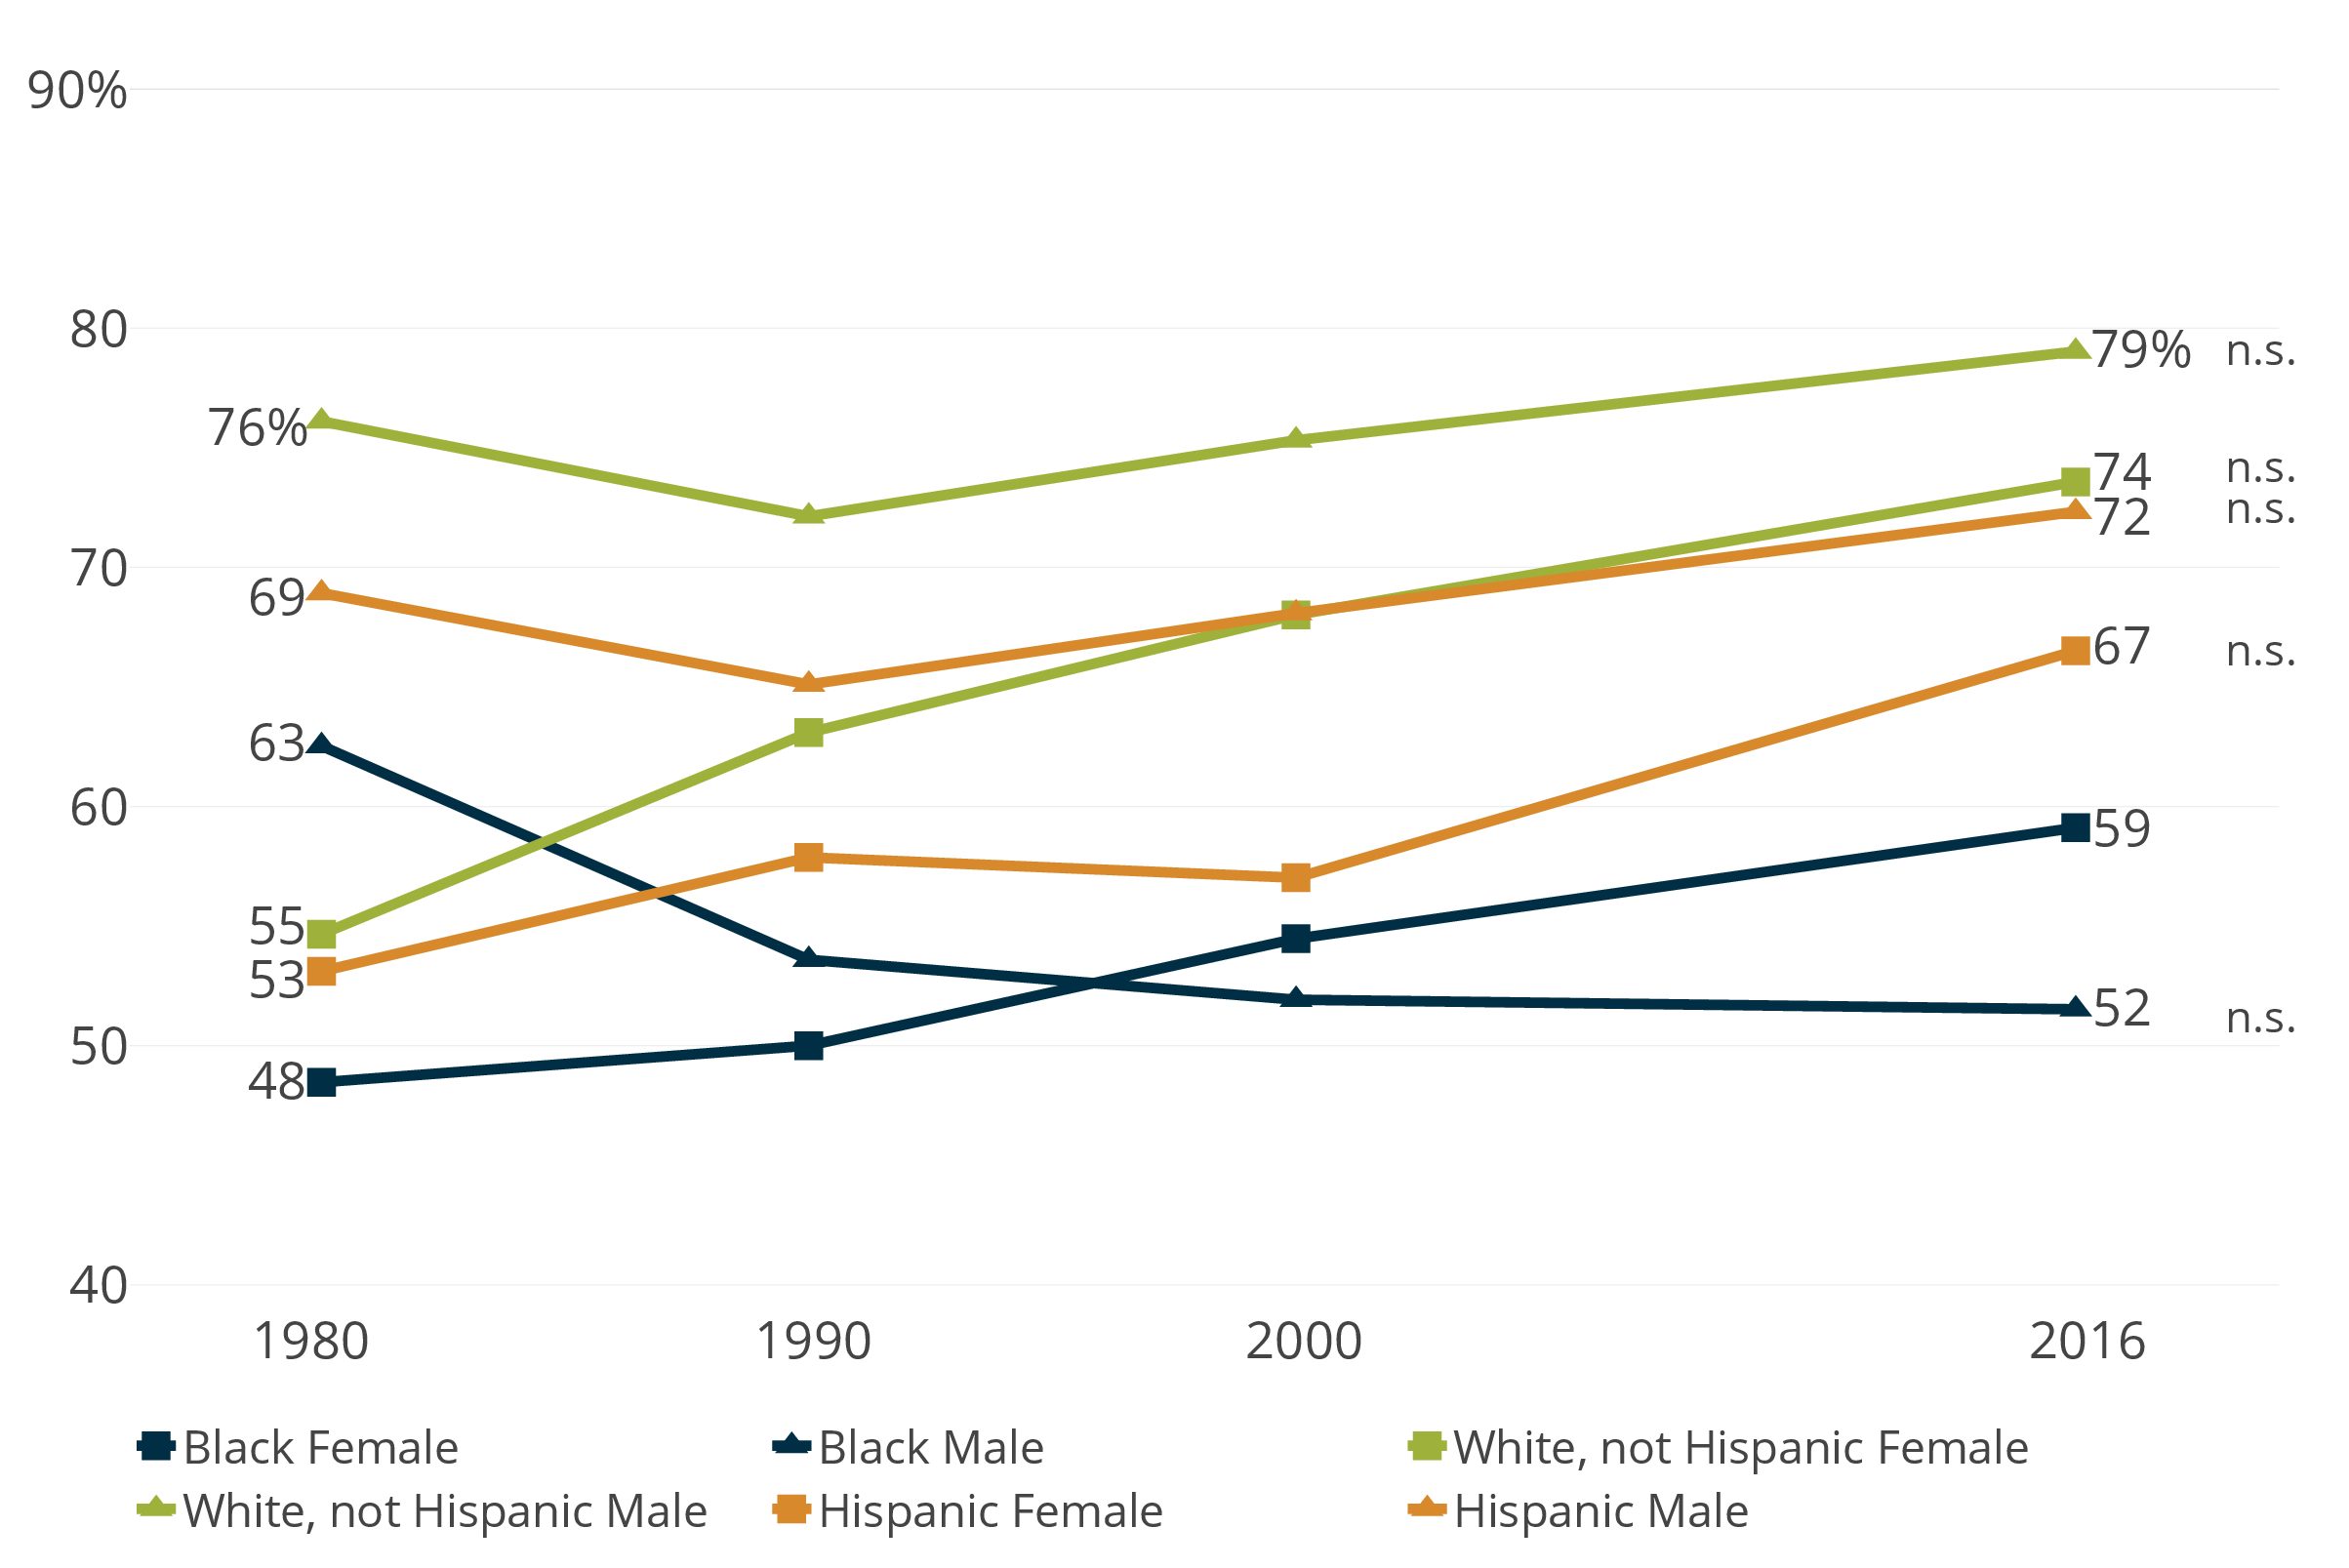
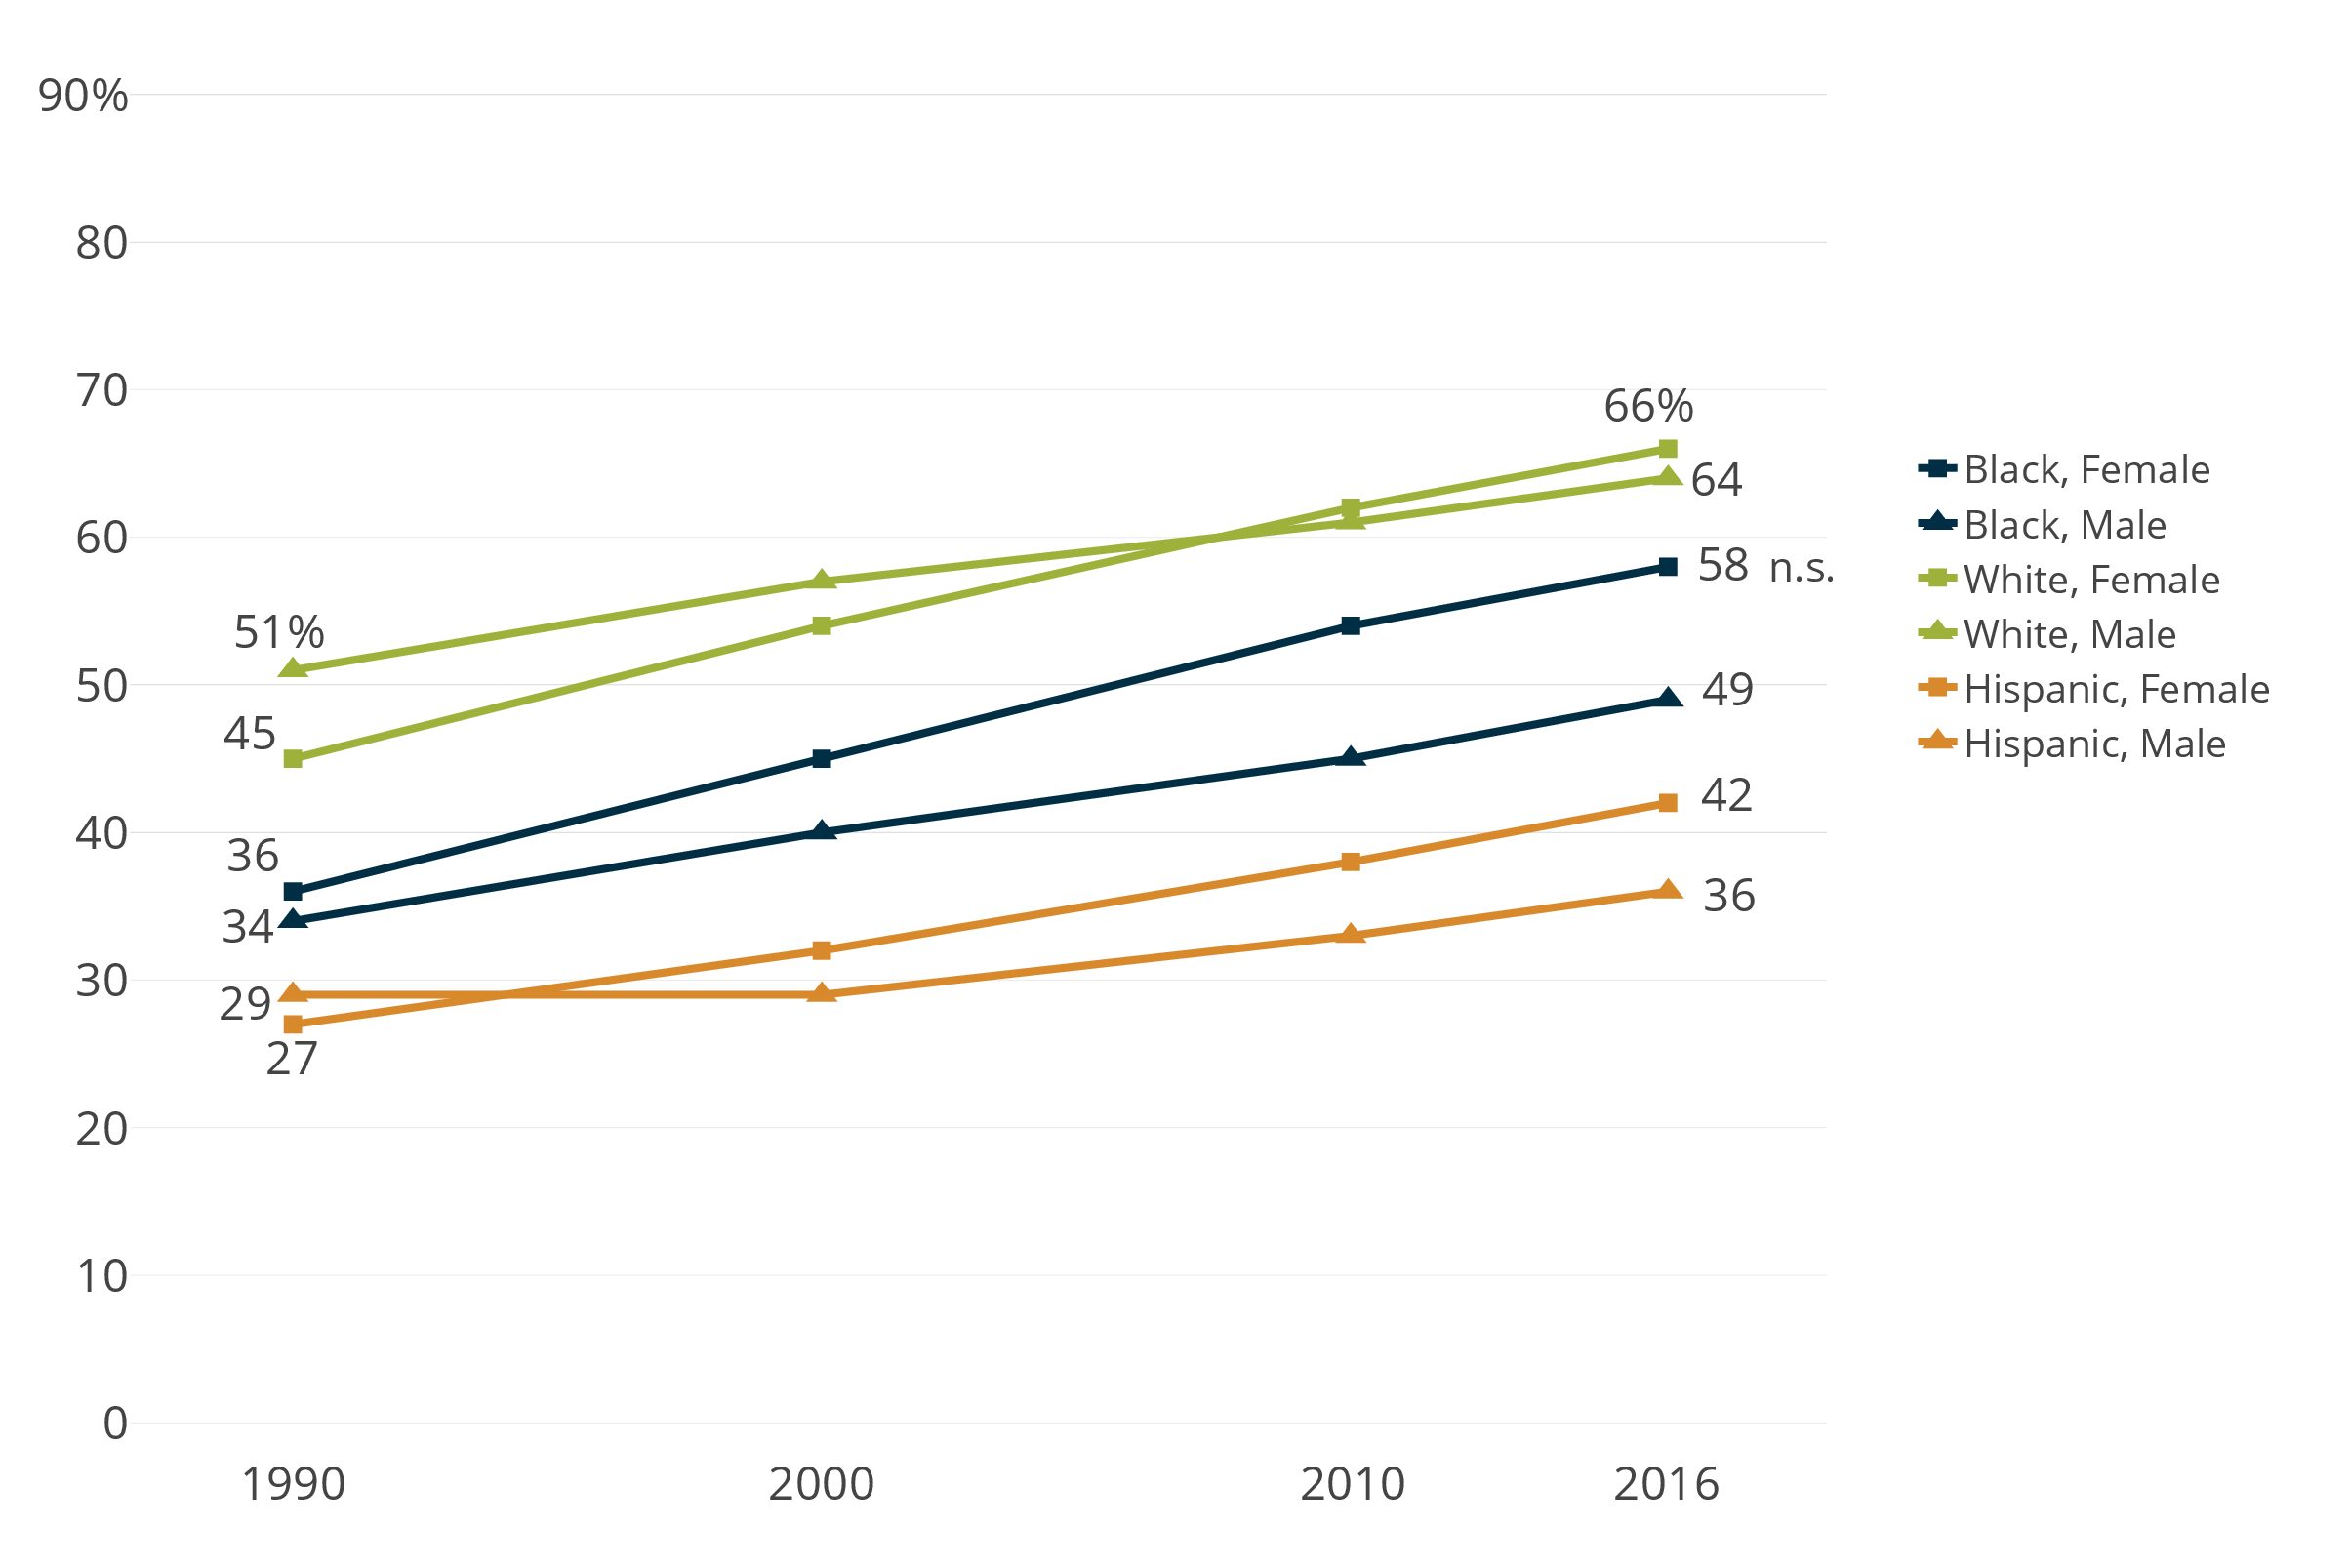
In the city of New Orleans, employment rates have risen for white men and women, Hispanic men and women, and black women compared with 1980, but have fallen for black men. In 2016 New Orleans, white men and women (at 79 percent and 74 percent respectively) are more likely to have employment than their national peers, while black men and women in New Orleans (at 52 and 59 percent respectively) are less likely to have employment than their national peers. The rates of employment for Hispanic men and women are not statistically different than their national peers.
As the national economy has shed jobs in male-dominated industries such as manufacturing over the last several decades, and grown jobs in female-dominated industries such as health care and education, employment rates for white men have fallen nationally while employment rates for white women have increased since 1980.4 In contrast, employment rates for white men in New Orleans have risen slightly (from 76 percent to 79 percent) between 1980 and 2016 (after dipping to 72 percent after the 1980s oil bust). Employment rates for Hispanic men have trended similarly to white men. Employment rates for white women have consistently risen from 55 percent in 1980 to 74 percent in 2016. Employment rates for Hispanic women have also grown from 53 percent to 67 percent. For black women employment rates have risen from 48 percent in 1980 to 59 percent in 2016. In New Orleans, only for black men have employment rates fallen—from 63 percent in 1980 to 52 percent in 2016.


Source: U.S. Census Bureau.
Notes: 1980 data for whites is inclusive of Hispanics (due to data source limitations).
n.s = Difference between white males and Hispanic males is not significant for 2016; Difference between white females and Hispanic females is not significant nor between black females and Hispanic females for 2016. Difference between Hispanic males and Hispanic females is not significant for 2016. Change over time is not significant for black males, Hispanic males, nor for Hispanic females for 2000-2016. Difference between U.S. and Orleans is not significant for Hispanic men nor for Hispanic women for 2016.
In 2016, employment rates in metro New Orleans are not statistically different than employment rates in the city of New Orleans for any of these groups except white women.
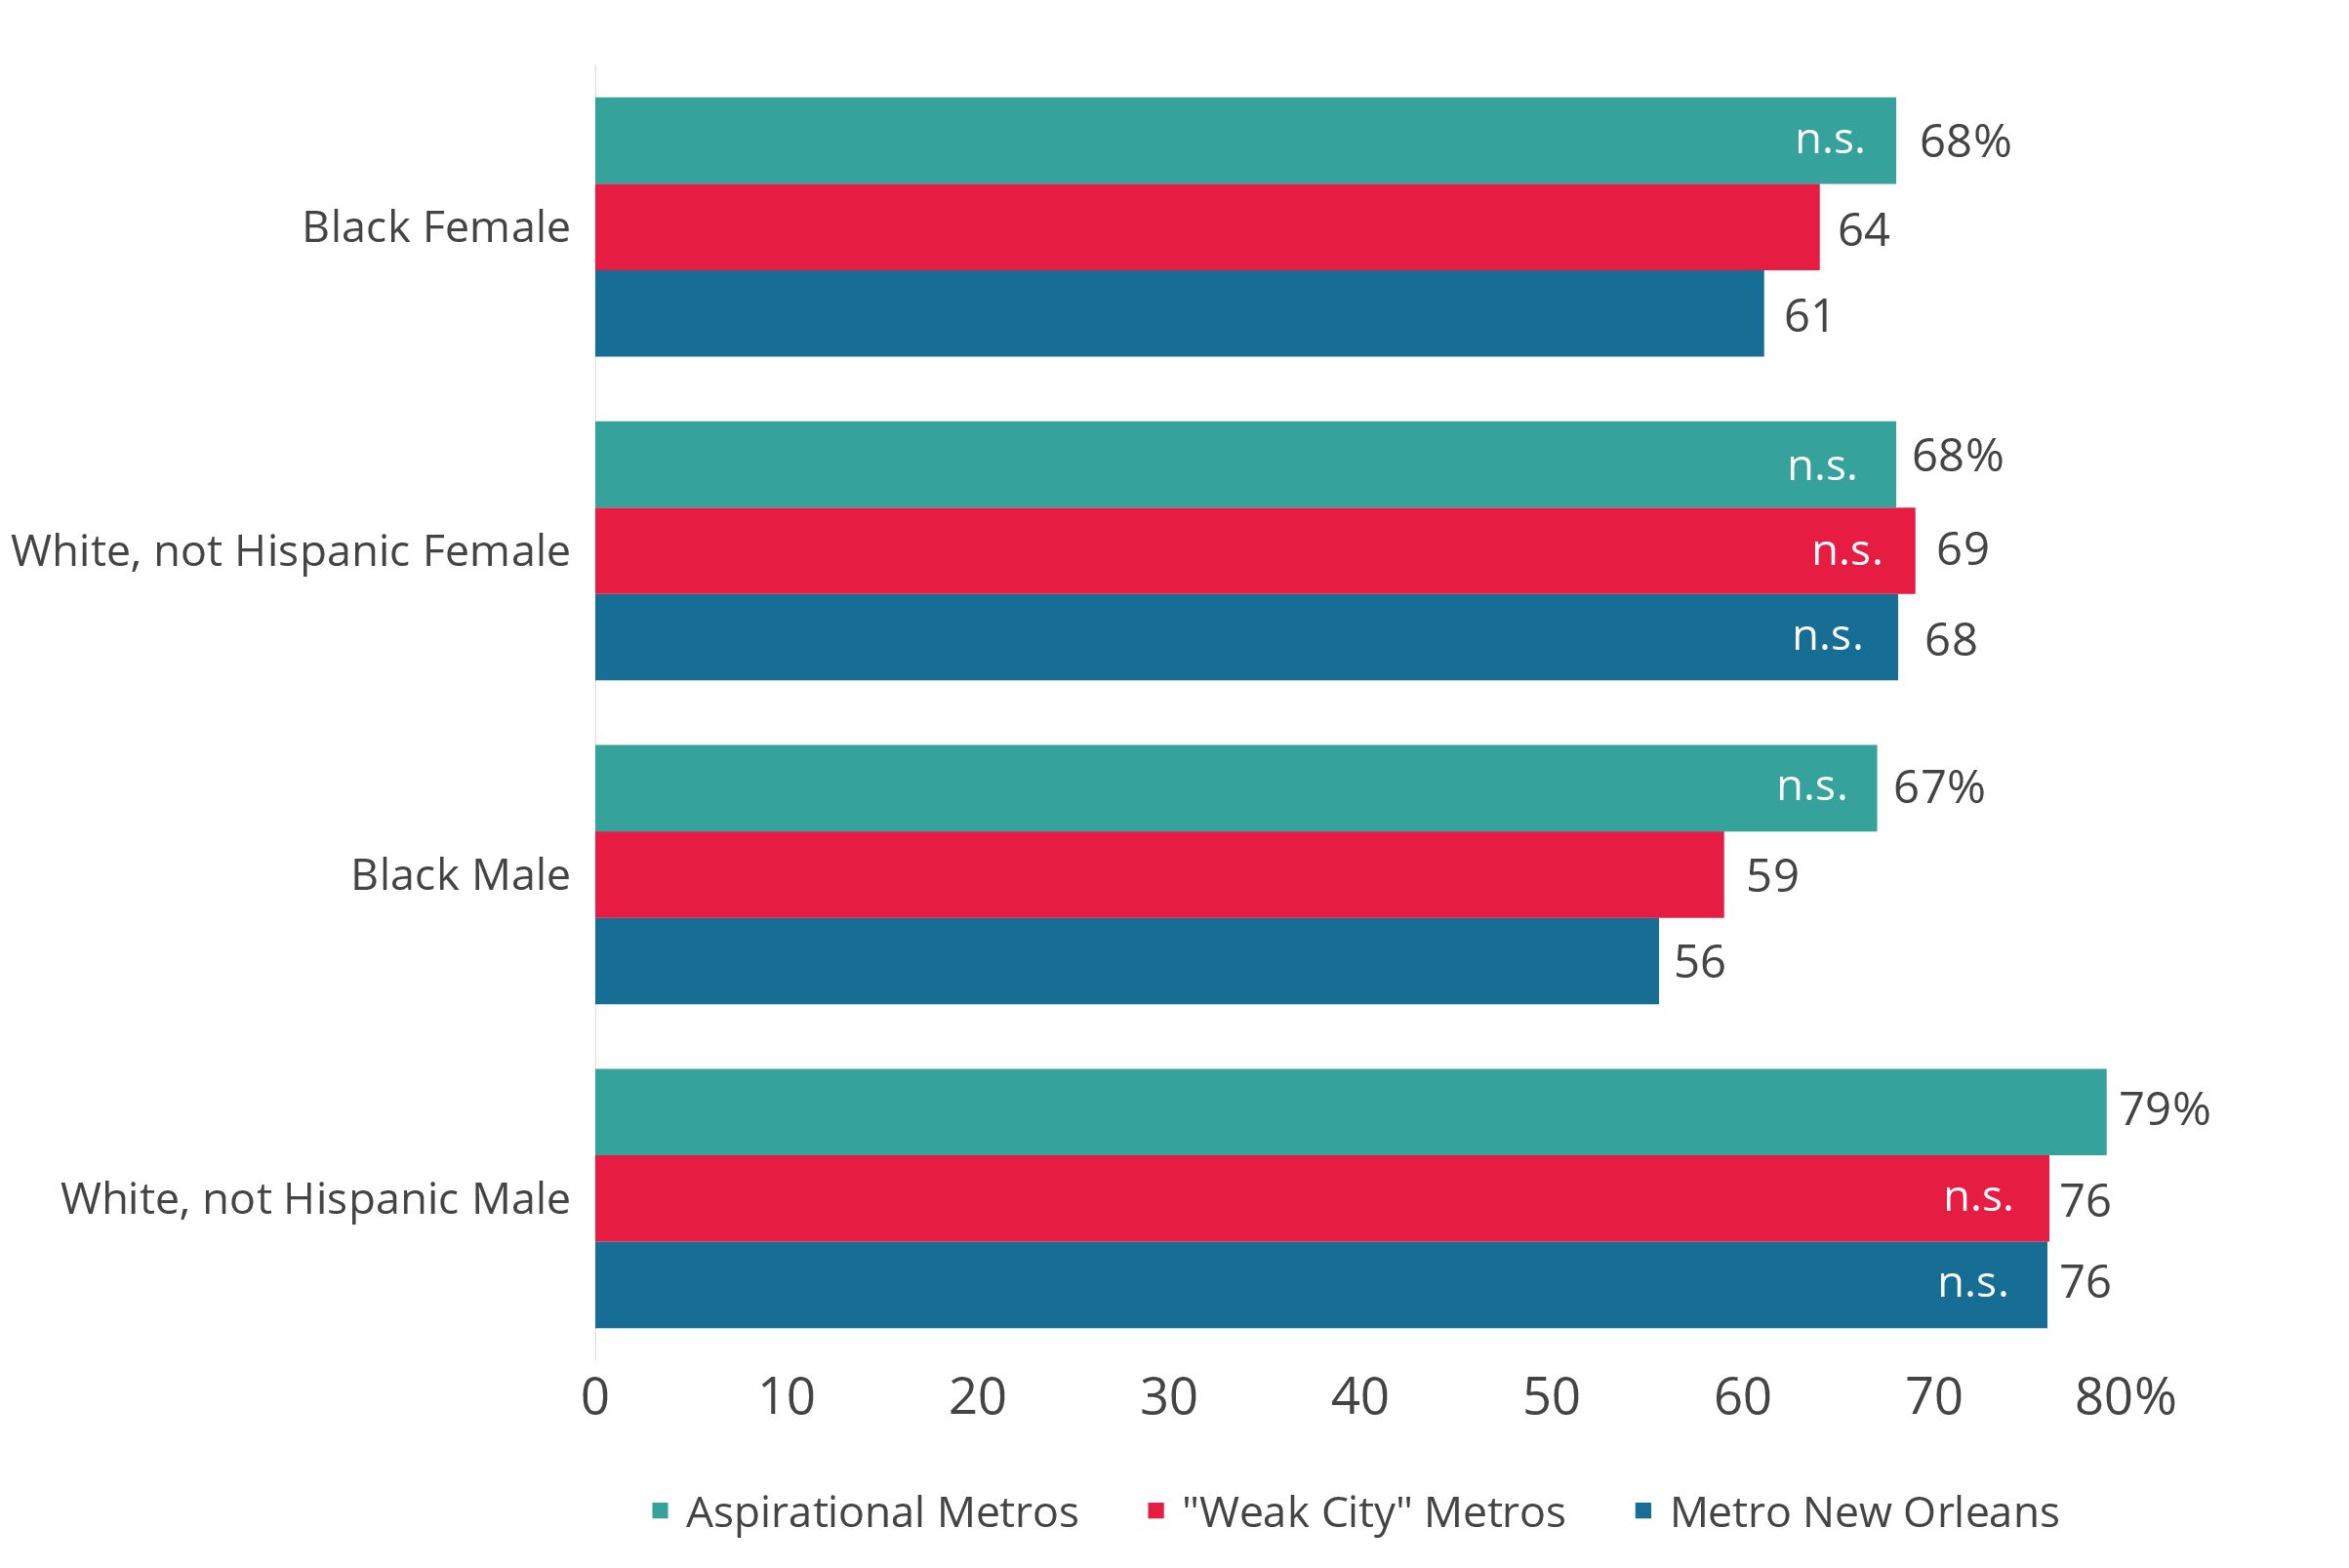
By 2016, employment rates for both black and white men in metro New Orleans have reverted to the level they were in 2000. Comparing employment rates between metro New Orleans and “weak city” metros as well as aspirational metros, 76 percent employment for white men in metro New Orleans is once again on par with “weak city” metros. At 56 percent, black men in metro New Orleans have employment at rates lower than “weak city” metros where 59 percent of black men are employed. In contrast, in fast growing “aspirational” southern metros, 79 percent of white men are employed (three percentage points higher than in metro New Orleans) and 67 percent of black men are employed (11 percentage points higher than in metro New Orleans).
Like black men, black women in metro New Orleans at 61 percent have employment rates that are lower than black women in both “weak city” metros (64 percent) and aspirational metros (68 percent). In contrast, the employment rate for white women in metro New Orleans, at 68 percent, is on par with their peers in “weak city” metros and aspirational metros. Large margins of errors associated with the employment rates for Hispanics makes them indistinguishable from their peers in comparison geographies.

Source: U.S. Census Bureau.
n.s = Not statistically significant at the .95 confidence level. See technical notes on page 59 of the report for more details.
-
WHY IS THIS IMPORTANT?
The federal definition for poverty, first created in 1964, was based on data that indicated that family food costs were about one-third of a family’s budget. The federal government estimated the cost of a nutritionally adequate diet in 1964 and multiplied that by three to come up with a minimum family budget. Housing costs have risen much faster than food costs since 1964. Moreover, poverty rate calculations are not adjusted for differences in standards of living in different parts of the country. Neither does the official poverty rate take into consideration non-cash government aid, such as Medicaid or housing subsidies. Several experts have worked to develop an alternative measure, often referred to as the living wage, to quantify the number of families who have adequate income to subsist without government subsidies. One of the most rigorous living wage calculations comes from Massachusetts Institute of Technology (MIT). Notably MIT’s living wage thresholds do include childcare and health care costs, which are determining factors in many adults’ ability to work. MIT’s thresholds are still conservative because they do not factor in the need to save for retirement and higher education.5
HOW IS NEW ORLEANS DOING?
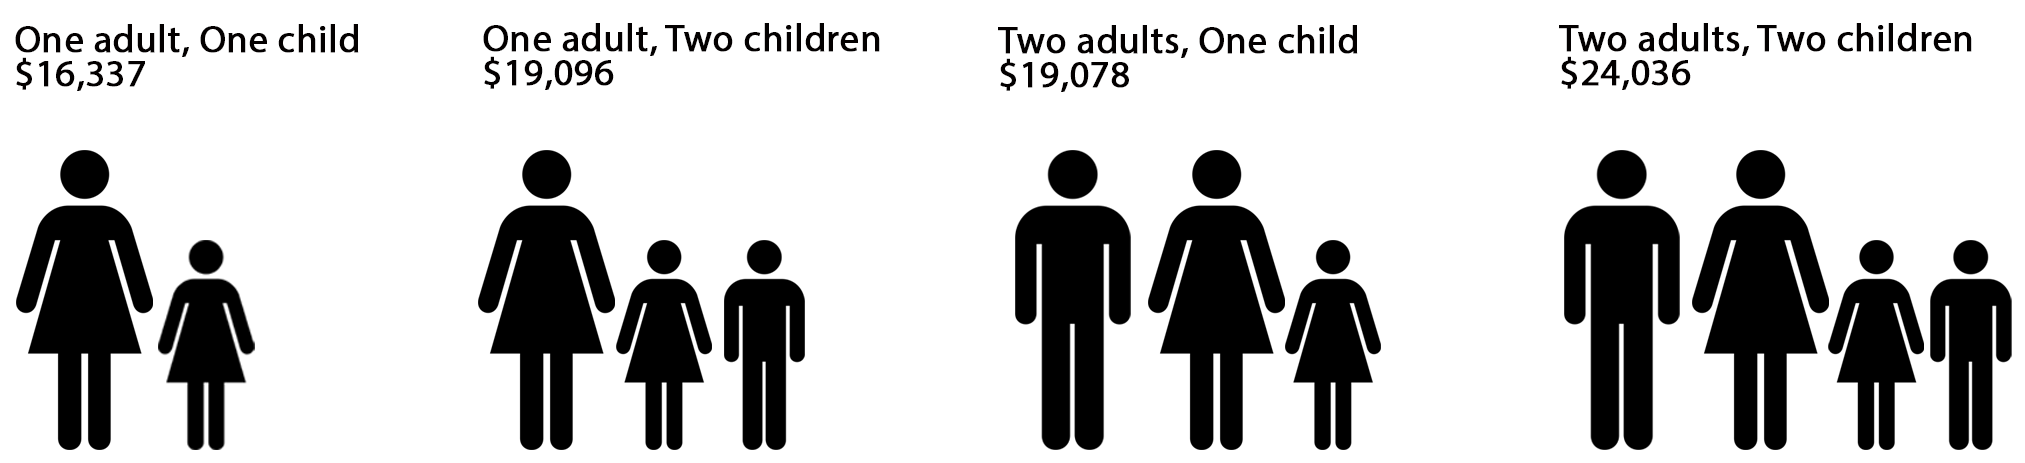
According to MIT, a living wage in 2016 New Orleans for one adult with one child is $22.89 per hour, or $47,611 annually. In 2016, approximately 4,500 Hispanic households, 17,500 white households, and 60,500 black households earned less than $45,000. All told, 71 percent of black households, 56 percent of Hispanic households, and 31 percent of white households in New Orleans did not earn sufficient income for one adult and one child to subsist without government subsidies.


Source: U.S. Census Bureau, MIT Living Wage Calculator
Note: Annual living wage for 1 Adult 1 Child in New Orleans in 2016 is $47,611. An annual income of $45,000 is the closest lower break point in the ACS tabulated data.
-
WHY IS THIS IMPORTANT?
By definition, poverty for children is a function of their family’s household income. In other words, the wages of adult family members determine whether children live in poverty. Poverty status is determined by comparing a family’s annual income to a set of poverty thresholds (in dollars) that vary by family size, number of children, and age of householder.6 If a family’s pre-tax income is less than their given poverty threshold, then that family and every individual in it are counted as living in poverty.
Scientific research has shown that child poverty can lead to chronic, toxic stress that disrupts the architecture of the developing brain. Children in poverty are much more likely to experience exposure to violence, chronic neglect, and the accumulated burdens of economic hardship. This kind of chronic stress causes prolonged activation of the stress response system which, in turn, can disrupt the development of brain architecture, leading to lifelong difficulties in learning, memory, and self-regulation.7 In short, scholars argue that poverty may be the single greatest threat to children’s healthy brain development.8 Moreover, childhood poverty has been linked to poor health outcomes in adults.9
HOW IS NEW ORLEANS DOING?
In the city of New Orleans, nearly half of all African American children live in poverty while 9 percent of white children are poor. In New Orleans, child poverty rates peaked in 1989 for black children and have fallen slightly such that they are now virtually the same as in 1979 with one in two black children living in poverty in 2015. Hispanic children experienced a similar peak in poverty in 1989 and a subsequent downtrend. But the margin of error on the child poverty rate for Hispanics is so large, that it is not significantly different than the child poverty rate for whites in New Orleans in 2015. The white poverty rate has hovered around one in ten children in poverty since 1979.

Source: U.S. Census Bureau.
Note: 1979 data for white children is inclusive of Hispanics (due to data source limitations).
n.s.= Difference between 1999 and 2015 is not significant for any races/ethnicities.
n.s = Difference between white and Hispanic is not significant for 2015.
EXAMPLES OF POVERTY THRESHOLDS
-
WHY IS THIS IMPORTANT?
The trading, or “export,” of products and services to other regions is the chief driver of regional growth and development.10 Specializations are traded clusters with a high concentration of total jobs relative to the United States. Specialization in specific traded clusters gives a region competitive advantages for jobs and private investment.11 Economists generally agree that an increase (or decrease) in the number of traded jobs actually causes an increase (or decrease) in the number of local-serving jobs.12 Moreover, specialized traded clusters generally pay higher wages.13 These engines of regional economies are often the focus of economic development efforts. Quantifying these clusters accurately (using Harvard’s U.S. Cluster Mapping Project) requires a more sophisticated analysis than is typically available in regional economic reports, but doing so allows for a clearer and unbiased understanding of those industries that drive growth in the New Orleans economy. The analysis below presents the clusters identified for metro New Orleans as a whole, but represents data on those jobs within New Orleans itself.14 The overrepresentation of people of color in certain industries contributes to income disparities and is not only a reflection of differences in educational attainment, but also discrimination—much of it unconscious—in hiring and compensation practices.15
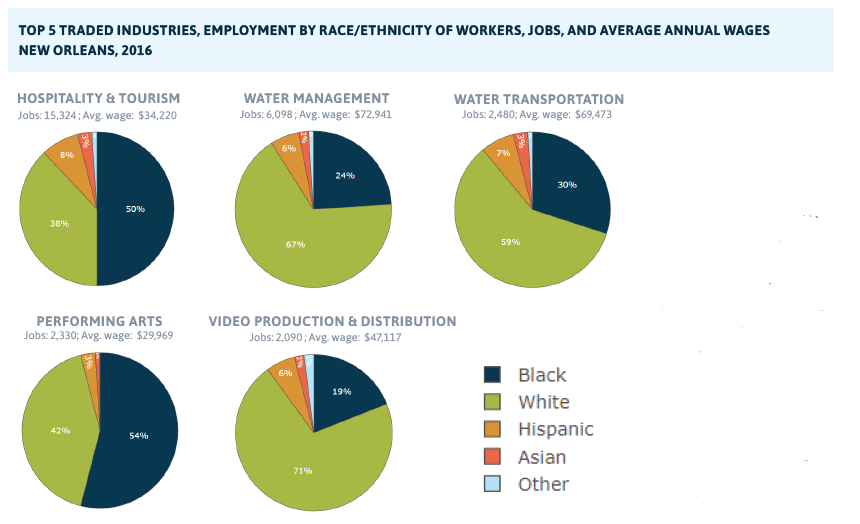
HOW IS NEW ORLEANS DOING?
With 15,324 jobs, hospitality and tourism is by far the largest traded cluster in New Orleans, and employs a workforce that is 50 percent black and 8 percent Hispanic. But with average wages (including tips) of only $34,220, tourism is not providing family sustaining wages to many families in New Orleans. Performing arts, with a workforce that is 54 percent black, 3 percent Hispanic, and earning average wages of $29,969, is similar to tourism albeit smaller with 2,330 jobs.
The second and third largest specialized clusters in New Orleans are water management and water transportation (6,098 and 2,480 jobs respectively), both of which pay higher wages ($72,941 and $69,473 respectively) but have disproportionate numbers of white workers (67 percent and 59 percent respectively.) The fifth largest specialized cluster industry is video production and distribution with 2,090 jobs. It pays wages averaging $47,117 to a largely white workforce (71 percent). Notably, on average, each of these three industries provides, or is very close to providing, a living wage in New Orleans.
Fishing and fishing products is an industry that employs a very diverse workforce—20 percent black, 16 percent Asian, 14 percent Hispanic and 4 percent “other”—and pays average wages of $74,634 but employs only 225 people in New Orleans.
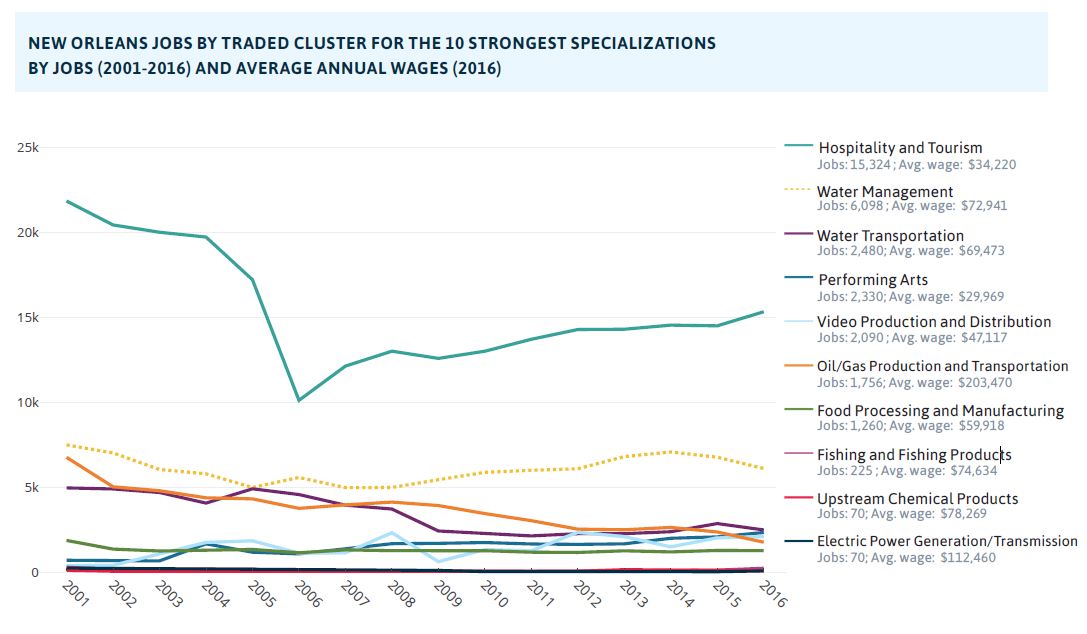
Source: EMSI and Harvard’s U.S. Cluster Mapping Project.
Notes: The above graph represents jobs in New Orleans for the 10 strongest specializations of the traded clusters in metro New Orleans. Average wages and race of workers are for jobs in New Orleans. All clusters are mutually exclusive except Water Management which may overlap with other clusters.
-
WHY IS THIS IMPORTANT?
Local-serving clusters, such as health services, retail, and government, are located in every region. Local-serving clusters make up about two-thirds of the jobs in any regional economy. For this reason, local clusters have been the targets for many workforce development efforts. They generally follow the ebbs and flows of the overall traded economy. If the traded economy is booming, population will grow and local clusters will boom.16 Although they are not engines of economic growth, they are important simply because of the number of people they employ and the services they provide. However, many local clusters pay less than traded clusters. The analysis below presents the clusters identified for metro New Orleans as a whole (using Harvard’s U.S. Cluster Mapping Project),17 but represents data on those jobs within New Orleans itself. The overrepresentation of people of color in certain industries contributes to income disparities and is not only a reflection of differences in educational attainment, but also discrimination—much of it unconscious—in hiring and compensation practices.18
HOW IS NEW ORLEANS DOING?
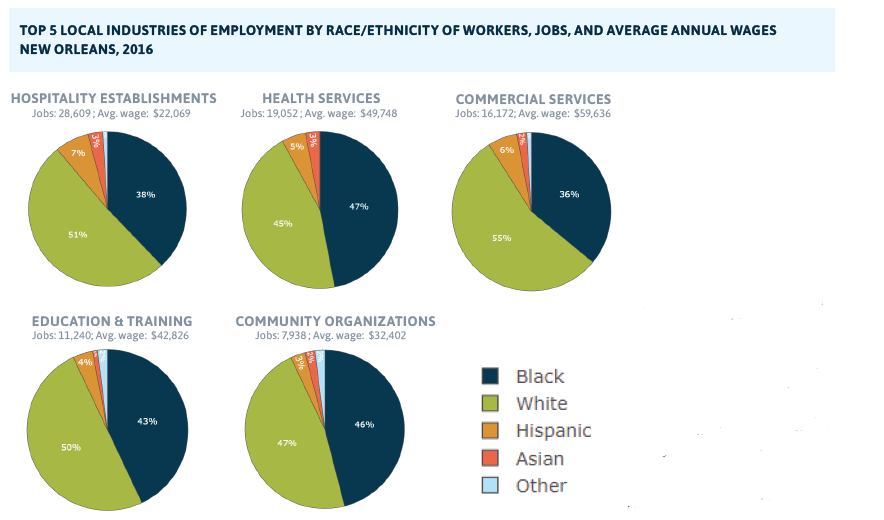
Hospitality establishments (which according to Harvard’s definition are local-serving) include full-service restaurants, fast food restaurants, country clubs, and fitness centers. As a cluster, these businesses have 28,609 jobs in New Orleans, pay average wages of $22,069 including tips, and their workforce is 51 percent white and 38 percent black. Health services is the second largest local cluster with 19,052 jobs, paying an average of $49,748, and having a workforce that is 47 percent black and 45 percent white. While health services jobs in New Orleans have rebounded to 64 percent of pre-Katrina levels,19 health care jobs metro-wide have reached more than 90 percent of pre-Katrina levels, suggesting that health care jobs have shifted from the city to the suburbs where they may be harder for New Orleans workers to reach. The city’s third largest local-serving cluster is commercial services, which employs 16,172 people and pays an average of $59,636 to a workforce that is 55 percent white and 36 percent black. Education and training organizations employ 11,240 in New Orleans and pay average wages of $42,826 to a workforce that is 50 percent white and 43 percent black. The fifth largest cluster, community organizations, has 7,938 jobs but pays an average of only $32,402 to a workforce that is 47 percent white and 46 percent black.
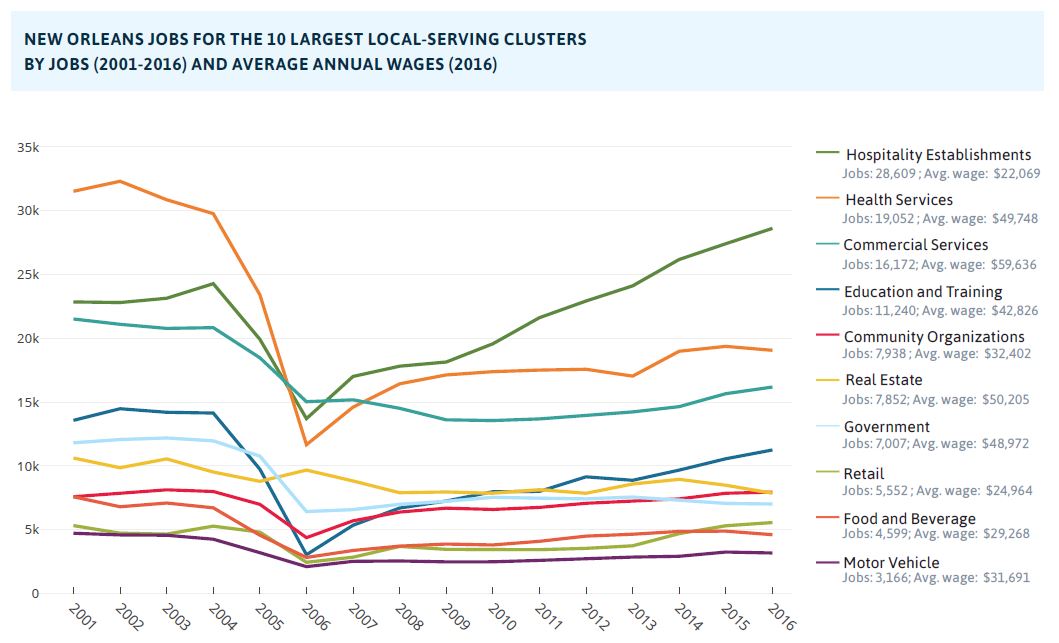
Source: EMSI and Harvard’s U.S. Cluster Mapping Project.
Notes: The above graph represents jobs in New Orleans for the 10 largest local-serving and government clusters in metro New Orleans. Average wages and race of workers are for jobs in New Orleans. All clusters are mutually exclusive.
-
WHY IS THIS IMPORTANT?
Minority-owned businesses offer various benefits to the communities within which they are located. They are more likely than other employers to hire minorities, especially low-income African Americans. They tend to invest in their local communities and foster additional economic growth.20 Also, minority-owned businesses can be key sites where information about jobs is exchanged and informal financial assistance is provided.21 Receipts are an important indicator of the scale of positive impact that minority-owned businesses can have in their communities.
HOW IS METRO NEW ORLEANS DOING?
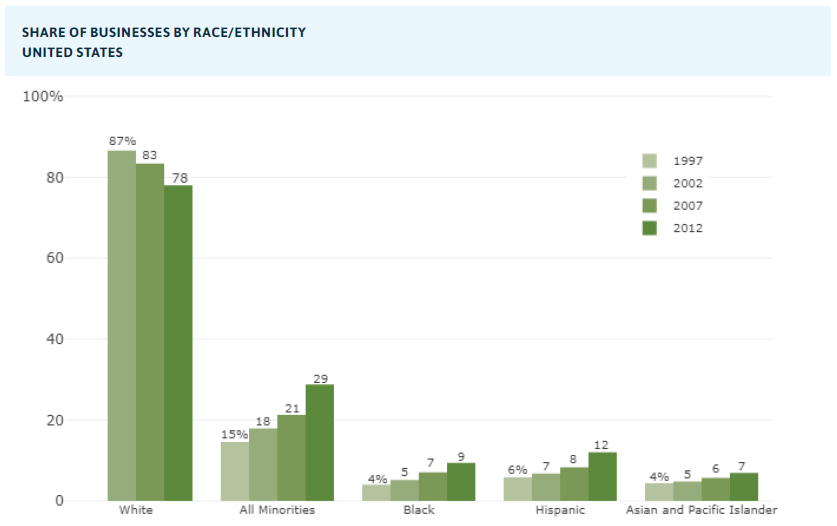
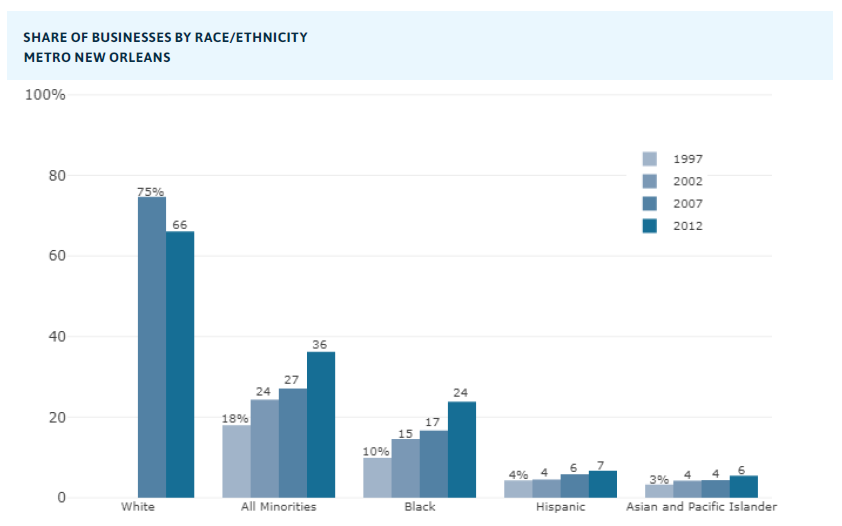
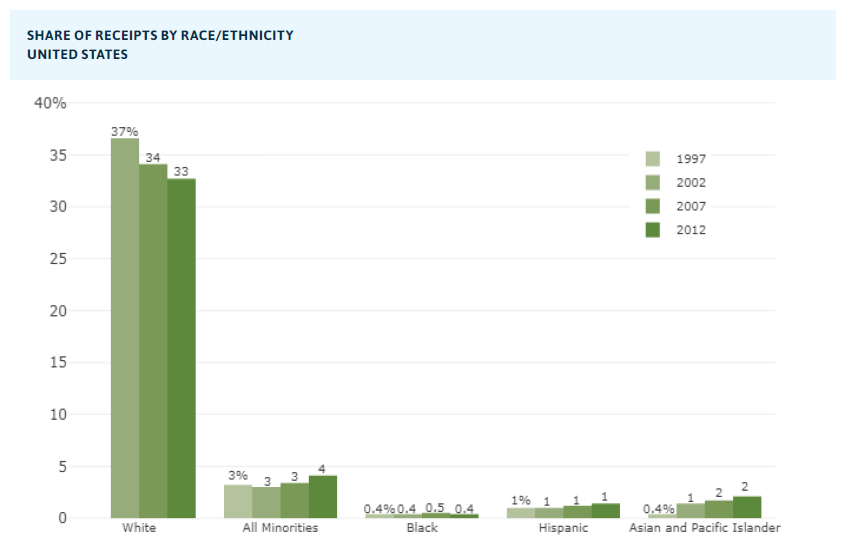
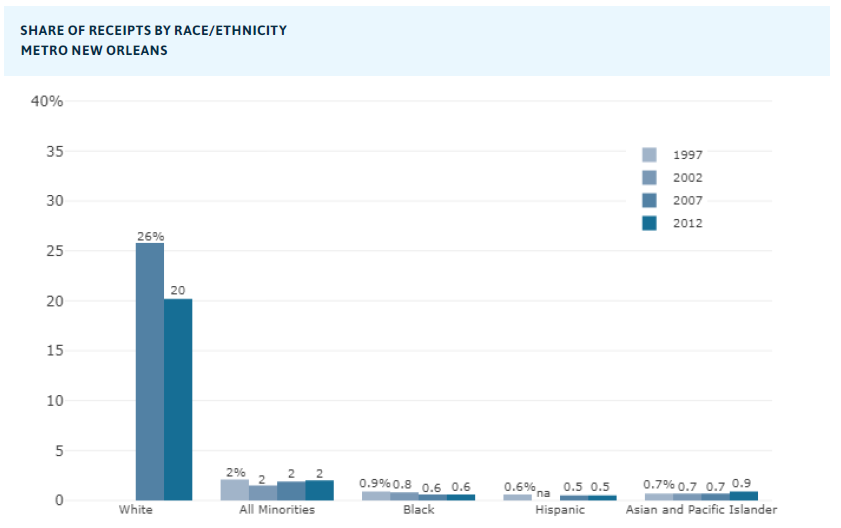
With 36 percent of all businesses (with and without employees) being minority-owned in 2012, metro New Orleans had a smaller share of minority-owned businesses relative to its minority population than the nation as a whole. And at a stagnant 2 percent of all receipts, the returns to these businesses have consistently fallen below the national average. Comparatively, minority-owned businesses represented 15 percent of all businesses in the U.S. in 1997 growing to 29 percent of all businesses nationwide in 2012. Receipts for minority-owned businesses have grown slightly across the U.S.—reaching 4 percent by 2012. In 1997, minority-owned businesses composed 18 percent of all businesses in metro New Orleans, more than half of which (10 percent) were black-owned businesses. By 2012, minority-owned businesses accounted for 36 percent of all businesses, with black-owned businesses accounting for 24 percent of all businesses.
Source: U.S. Census Bureau .
Notes: The number of minority-owned businesses and receipts includes businesses with and without paid employees. Data for white-owned businesses is not available in 1997 and 2002. Because a business owner may be counted in multiple race/ ethnicity categories (e.g., white and Hispanic), the categories do not sum to 100 percent.
HOW IS NEW ORLEANS DOING?
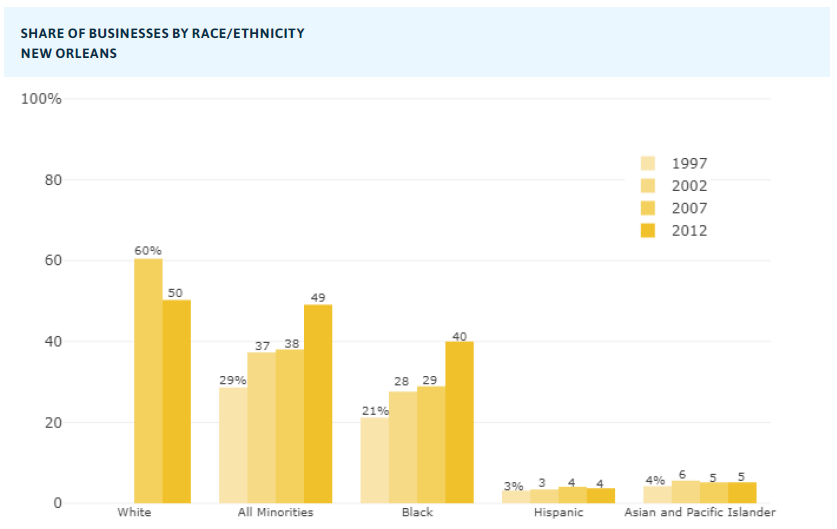
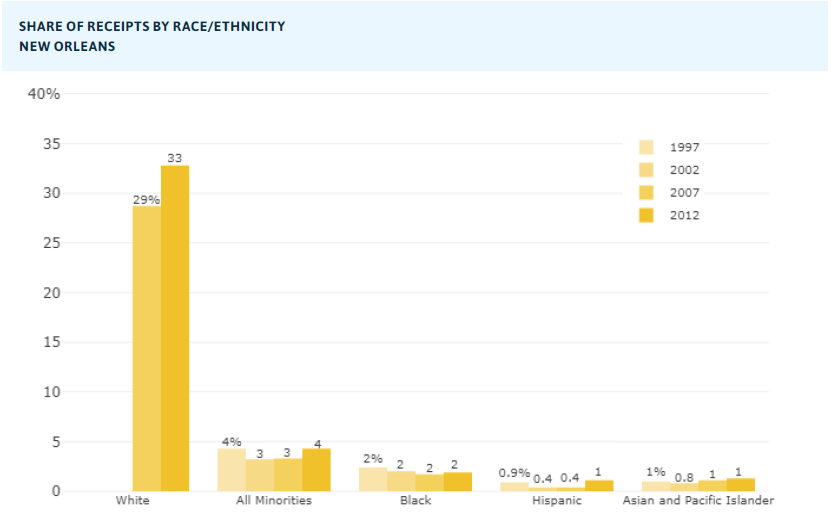
Nearly half (49 percent) of all businesses with and without employees in New Orleans are minority-owned, but this represents a smaller share of minority-owned businesses relative to New Orleans’ minority population than the metro area or the U.S. Despite the fact that nearly half of all businesses in New Orleans are minority-owned, they receive only 4 percent of all receipts. African Americans account for a particularly fast-growing share of business owners in New Orleans—from 21 percent in 1997 to 40 percent in 2012. But total receipts to those businesses have remained stagnant at roughly 2 percent over that time frame. Hispanics and Asians account for a smaller share of business-owners, representing about 4 percent and 5 percent of New Orleans businesses respectively, and receiving roughly 1 percent of receipts each.
Source: U.S. Census Bureau .
Notes: The number of minority-owned businesses and receipts includes businesses with and without paid employees. Data for white-owned businesses is not available in 1997 and 2002. Because a business owner may be counted in multiple race/ethnicity categories (e.g., white and Hispanic), some business owners may be represented in more than one category.
Housing
- Homeownership by Race and Ethnicity
- Housing Affordability
-
WHY IS THIS IMPORTANT?
In the United States, homeownership is often assumed to be an important means of acquiring wealth. However, experts have increasingly pointed out that neighborhood and regional housing markets can experience downturns, during which homeowners can lose their accumulated equity.22 Moreover, decades old policies and practices hamper minorities from benefitting from strong housing markets, which has contributed to weaker wealth accumulation for people of color who own homes.23 Still homeownership can be an important means of achieving residential stability and has been shown to be related to improved psychological health and greater participation in social and political activities.24 Studies have revealed that discriminatory practices in the real estate and banking industries are still common and present an obstacle to homeownership for many people of color.25
HOW IS NEW ORLEANS DOING?
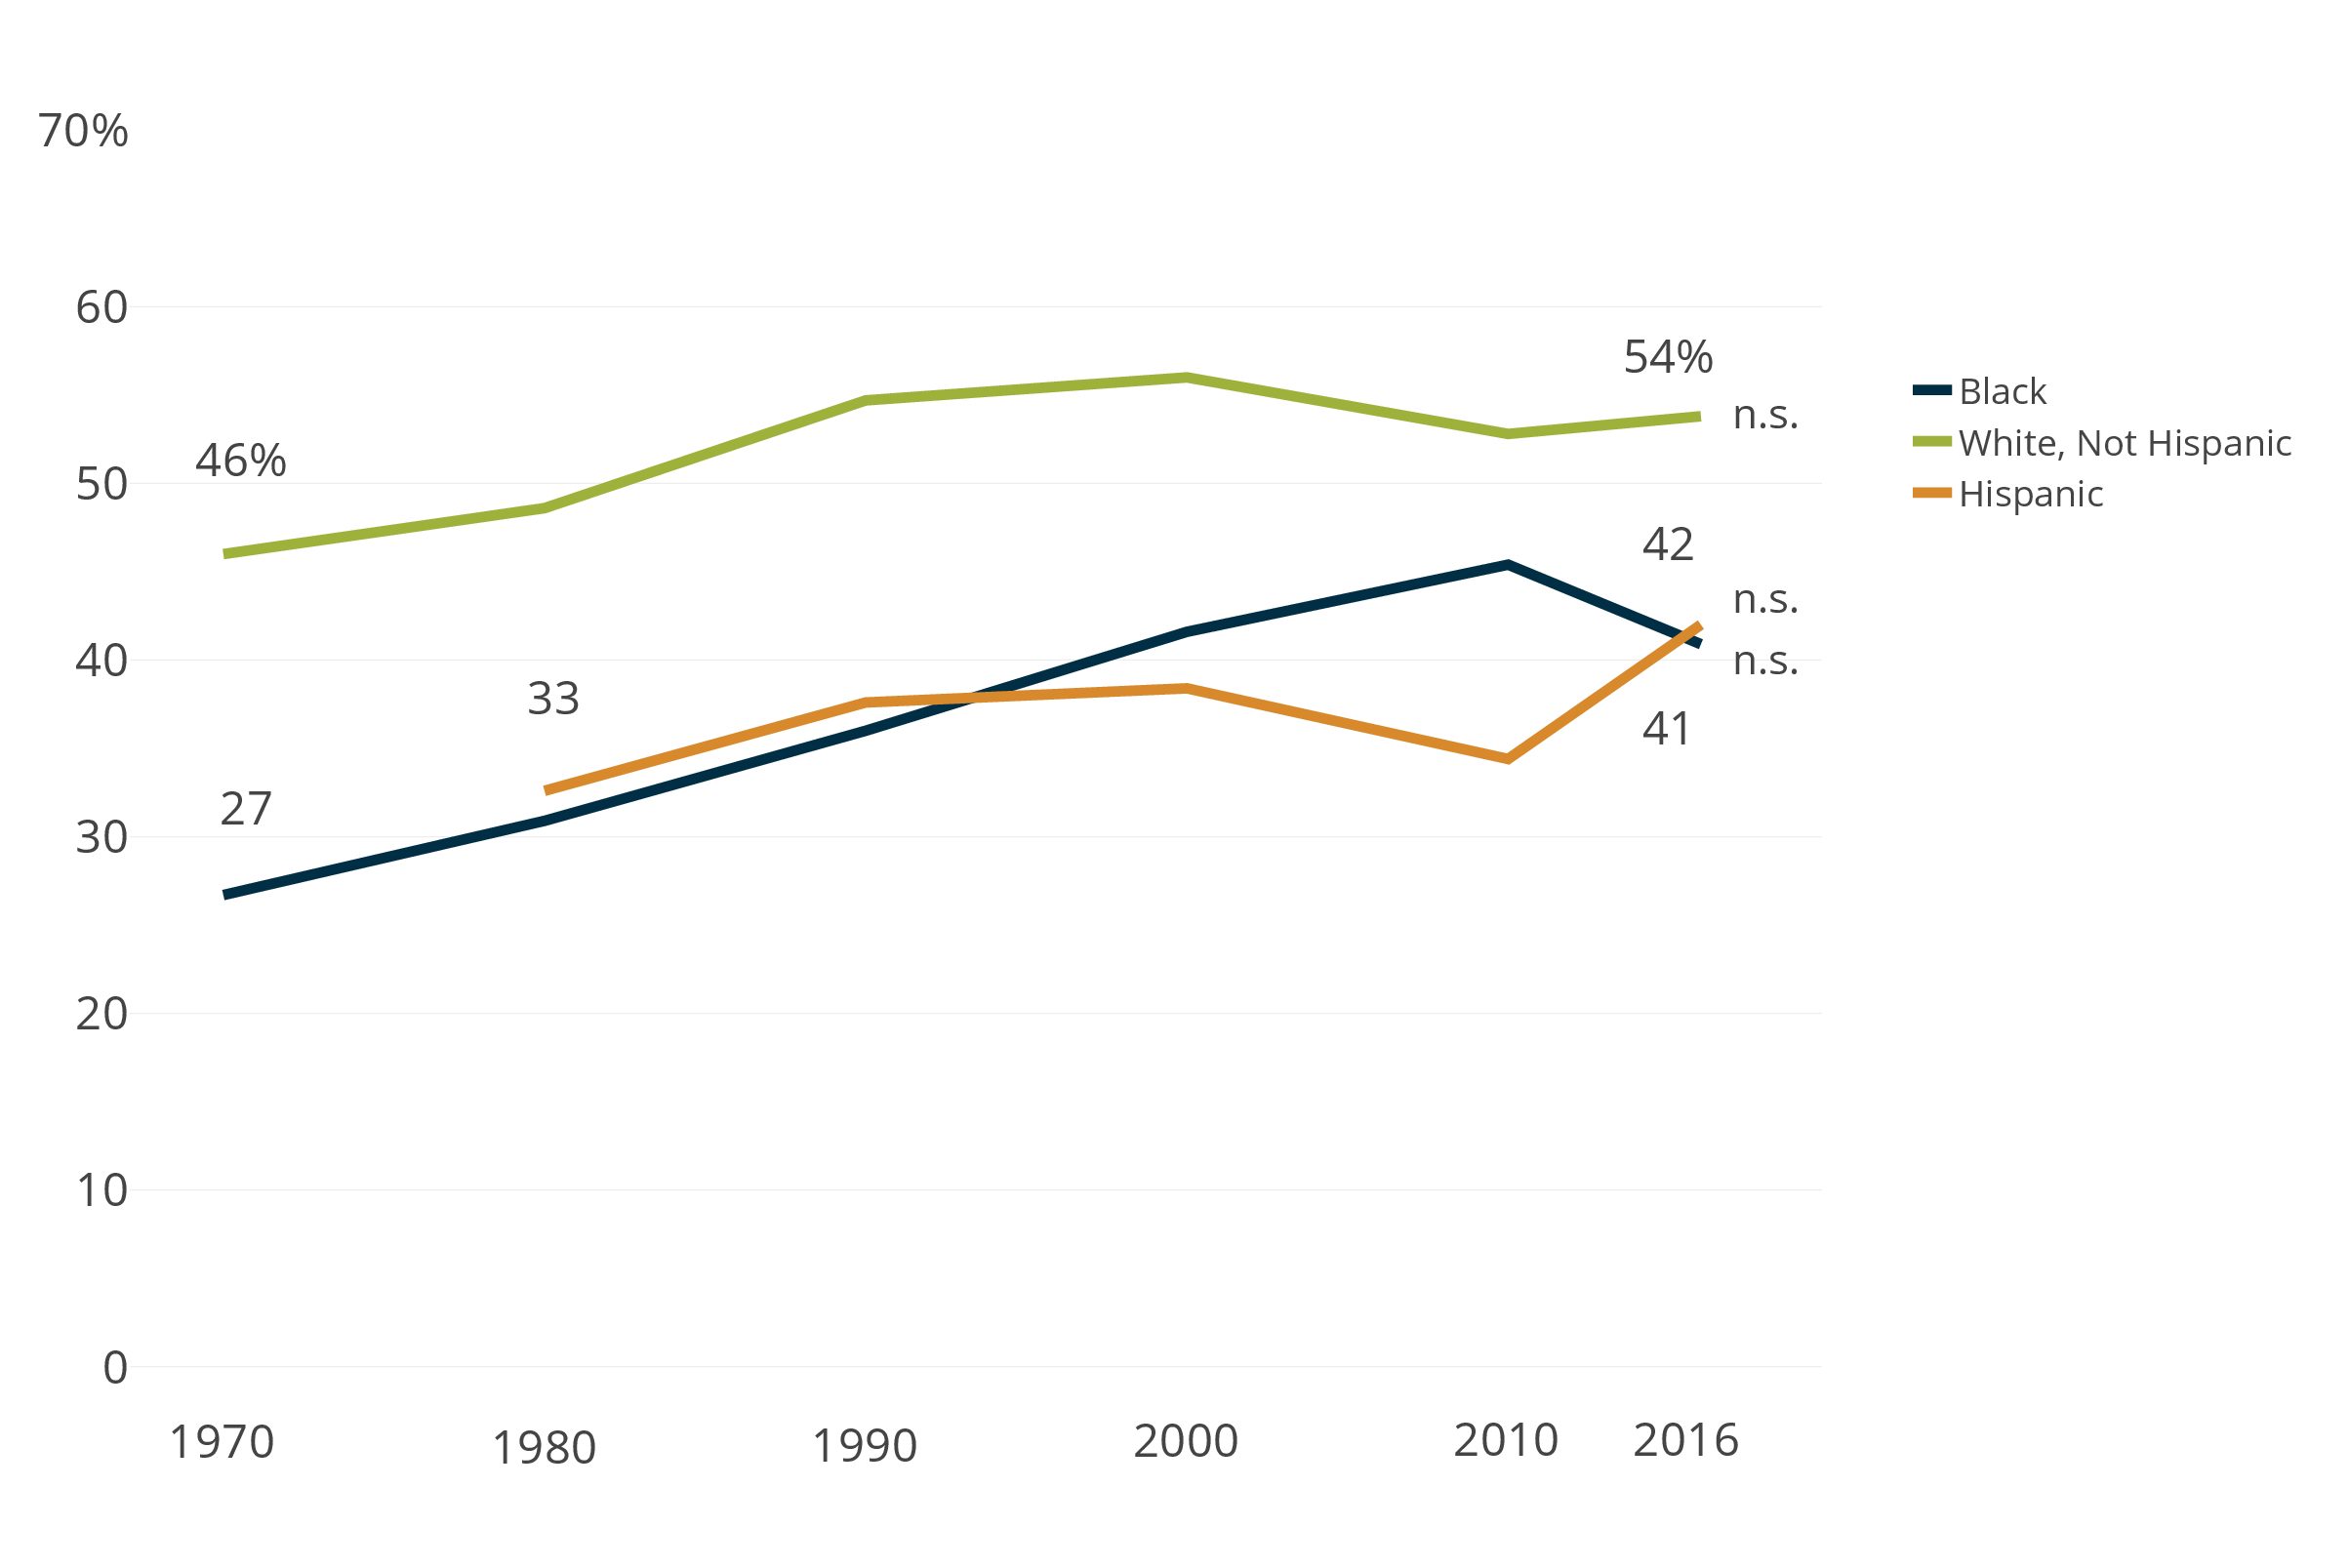
Homeownership rates among African Americans in New Orleans made consistent progress between 1970 and 2010, increasing from 27 percent to 45 percent, but fell to 41 percent by 2016. Still, the difference in homeownership rates between blacks and whites in 2016 was significant, with only 41 percent of African Americans in New Orleans owning homes compared to 54 percent of whites. The increase in the homeownership rate among African Americans in 2010 may be a reflection of the slower rate of return of African American renters post-Katrina, and the dip to 41 percent in 2016 may reflect the redevelopment of more rental housing (including public housing sites) since 2010.26

Source: U.S. Census Bureau.
Notes: 1970 and 1980 data for whites is inclusive of Hispanics (due to data source limitations).
n.s = Difference between black and Hispanic and between white and Hispanic is not significant for 2016. Change in time is not significant for any races/ethnicities for 2000-2016. Change in time is not significant for white or Hispanic for 2010-2016.
-
WHY IS THIS IMPORTANT?
Housing is a large monthly expense for nearly every American household, and the ability to afford stable housing can significantly impact a family’s well-being. It is also the most significant contributing factor for determining a region’s cost of living. A common measure of affordability communitywide is the percent of households paying more than 30 percent of their pre-tax income on all housing costs. While lower-income households often can afford to spend a lesser share of their income for housing and higher-income households can afford a higher share, longitudinal data is only available at the 35 percent threshold.27 This indicator looks at households paying unaffordable housing costs of 35 percent or more of their pre-tax income.
HOW IS NEW ORLEANS DOING?
Fully 51 percent of renters in New Orleans paid unaffordable housing costs in 2016, significantly higher than the 41 percent of renters nationally. Despite anecdotes about New Orleans’ relatively inexpensive housing pre-Katrina, the data suggests that city renters have historically struggled to afford housing costs compared to their national peers. As incomes declined during the oil bust of the 1980s, the share of renters paying at least 35 percent of their household income on housing—a threshold considered unaffordable—increased. As incomes increased during the 1990s, that share declined. Since then, higher rents, compounded by lower household incomes, have contributed to an increase in the share of city renters paying unaffordable housing costs.
New Orleans’ homeowners also struggle more than their national peers to afford housing costs. In the city, 25 percent of homeowners spend more than 35 percent of pre-tax household income on their mortgage, taxes, utilities, and insurance compared to only 17 percent of homeowners nationwide.

Source: U.S. Census Bureau.
Notes: Homeowner data before 2004 is not comparable because it excludes units in multi-unit buildings (e.g. condos and duplexes) and housing units with a business office.
n.s = Changes from 2004 to 2010; 2010 to 2016; and 2004 to 2016 are not significant for New Orleans for renters or homeowners.
Democracy
- Voter Turnout by Race and Ethnicity
-
WHY IS THIS IMPORTANT?
Voting is a form of civic engagement that contributes to the shaping of public policy. In addition, high voter participation rates increase elected officials’ sense of accountability to voters. Historically, women and people of color did not have the right to vote. More recently, voter participation has been greater among individuals with higher education levels and higher incomes.28 Increases in voter participation among historically disenfranchised voters can be an important step toward more inclusive and equitable policies.
HOW IS NEW ORLEANS DOING?
In 2000, 63 percent of white registered voters in New Orleans cast their vote for president, and in 2016, 68 percent of white voters did so. African American voter participation lagged white voter participation by 3 percentage points in 2000 and by 6 percentage points in 2016. Despite the successful campaign of President Barack Obama (the country’s first African American president), in 2008 the lag between African American and white voter participation rates grew to 7 percentage points, likely because many African Americans registered to vote in New Orleans were still displaced due to Hurricane Katrina and the levee failures. Notably, African American participation in the presidential election of 2012 surged to 65 percent— one percentage point above the white participation rate—likely due to the strong interest in reelecting President Obama.
Voter participation in mayoral elections is lower than for presidential elections among New Orleans voters. In most mayoral elections from 2002 to 2017, voter participation rates among registered African Americans in New Orleans lagged participation rates for whites by 2 to 5 percentage points with the exception of 2006 and 2010. In those two years, African American voter participation in mayoral elections lagged white participation by 16 percentage points likely because many African American New Orleanians registered to vote in Orleans Parish were still displaced due to Hurricane Katrina and the levee failures.
Perhaps more importantly, both white and black voter participation in mayoral elections has declined since 2002 when voter participation was 48 percent among registered white voters and 44 percent among registered blacks. In the most recent mayoral election, voter participation was 35 percent among whites and 33 percent among black voters. Fewer people voting may indicate growing dissatisfaction with the political process and represents a loss in civic voice.
Effective January 1, 2015, all 16-year-olds who are applying for a driver’s license are automatically pre-registered to vote. In the future, the number of people registered may increase and, thus, voter participation rates may dampen somewhat.29


Source: Louisiana Secretary of State.
Health
- Lack of Health Insurance Coverage by Race and Ethnicity
- Mortality Rates by Race
- Low Birth Weights by Race, Ethnicity, and Educational Attainment
-
WHY IS THIS IMPORTANT?
Health insurance coverage increases an individual’s likelihood of receiving quality medical care.30 Health insurance is important for preventive care as well as timely treatment of illnesses or injuries.31 Those who lack health insurance often do not get timely treatment for chronic illnesses.32 When insurance coverage is low, costs to society are often high in the form of emergency room visits and lost worker productivity.33 Examining insurance rates for adults ages 18 to 64 is particularly important because most adults age 65 and older have high rates of health insurance coverage due to Medicare, and low-income children have coverage due to Medicaid and CHIP.34 While health insurance coverage is very important, insurance coverage does not guarantee availability of care nor access to health care services.35
HOW IS NEW ORLEANS DOING?
While data before 2009 is not available for an area as small as New Orleans, trends since 2009 are generally positive across race and ethnicity. The share of African Americans ages 18 to 64 without health insurance coverage fell from 37 percent in 2009 to 14 percent in 2016. The share of whites without health insurance fell from 21 percent to 10 percent over the same years. Notably the gap between black and white coverage rates closed from 16 percentage points in 2009 to only 4 percentage points in 2016. While the share of Hispanics without health insurance coverage remained relatively high at 33 percent in 2016, it too had shrunk substantially since 2009 when 54 percent of Hispanics in New Orleans did not have health insurance. African Americans had a 23 percentage point drop from 2009 to 2016, Hispanics had a 21 percentage point drop, and whites had a 11 percentage point drop. These trends were well underway before Louisiana expanded Medicaid eligibility effective July 1, 2016.36

Source: U.S. Census Bureau.
n.s = Change over time is not significant for white and Hispanic for 2014-2016. Change over time is not significant for white and Hispanic for 2015-2016.
-
WHY IS THIS IMPORTANT?
Disparities in the leading causes of death for blacks compared with whites are closely related to disparities in life expectancy by race.37 Disparities in mortality rates may indicate lack of access to health care, differing risk factors such as nutrition and exposure to air pollutants, but also poorer quality of care. Lesser quality of care has been shown to be influenced by racial bias in how medical professionals interact with African American patients—much of it unconscious.38 Research also highlights that segregated neighborhoods increase mortality due to exposure to toxins, substandard housing, and violence.39 Identifying the largest disparities and targeting appropriate interventions is important for creating equal opportunities for health.40
HOW IS NEW ORLEANS DOING?
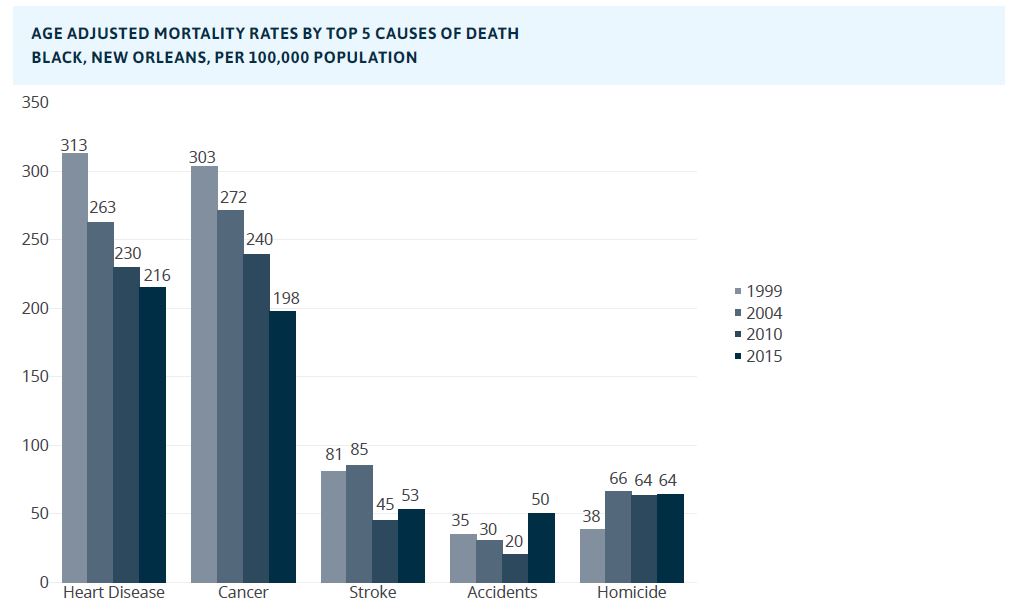
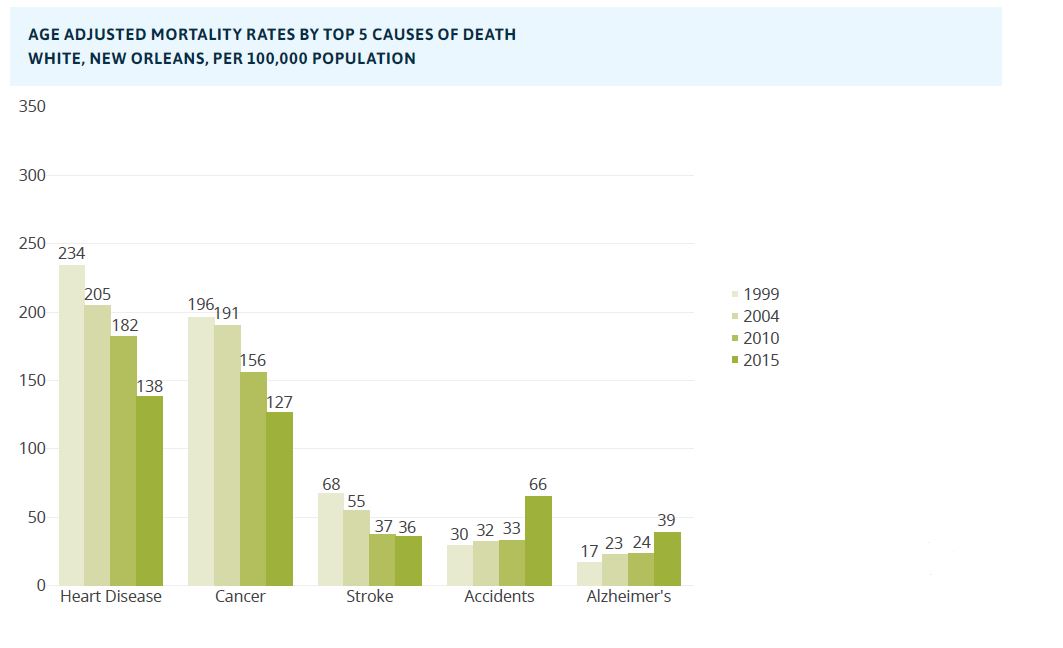
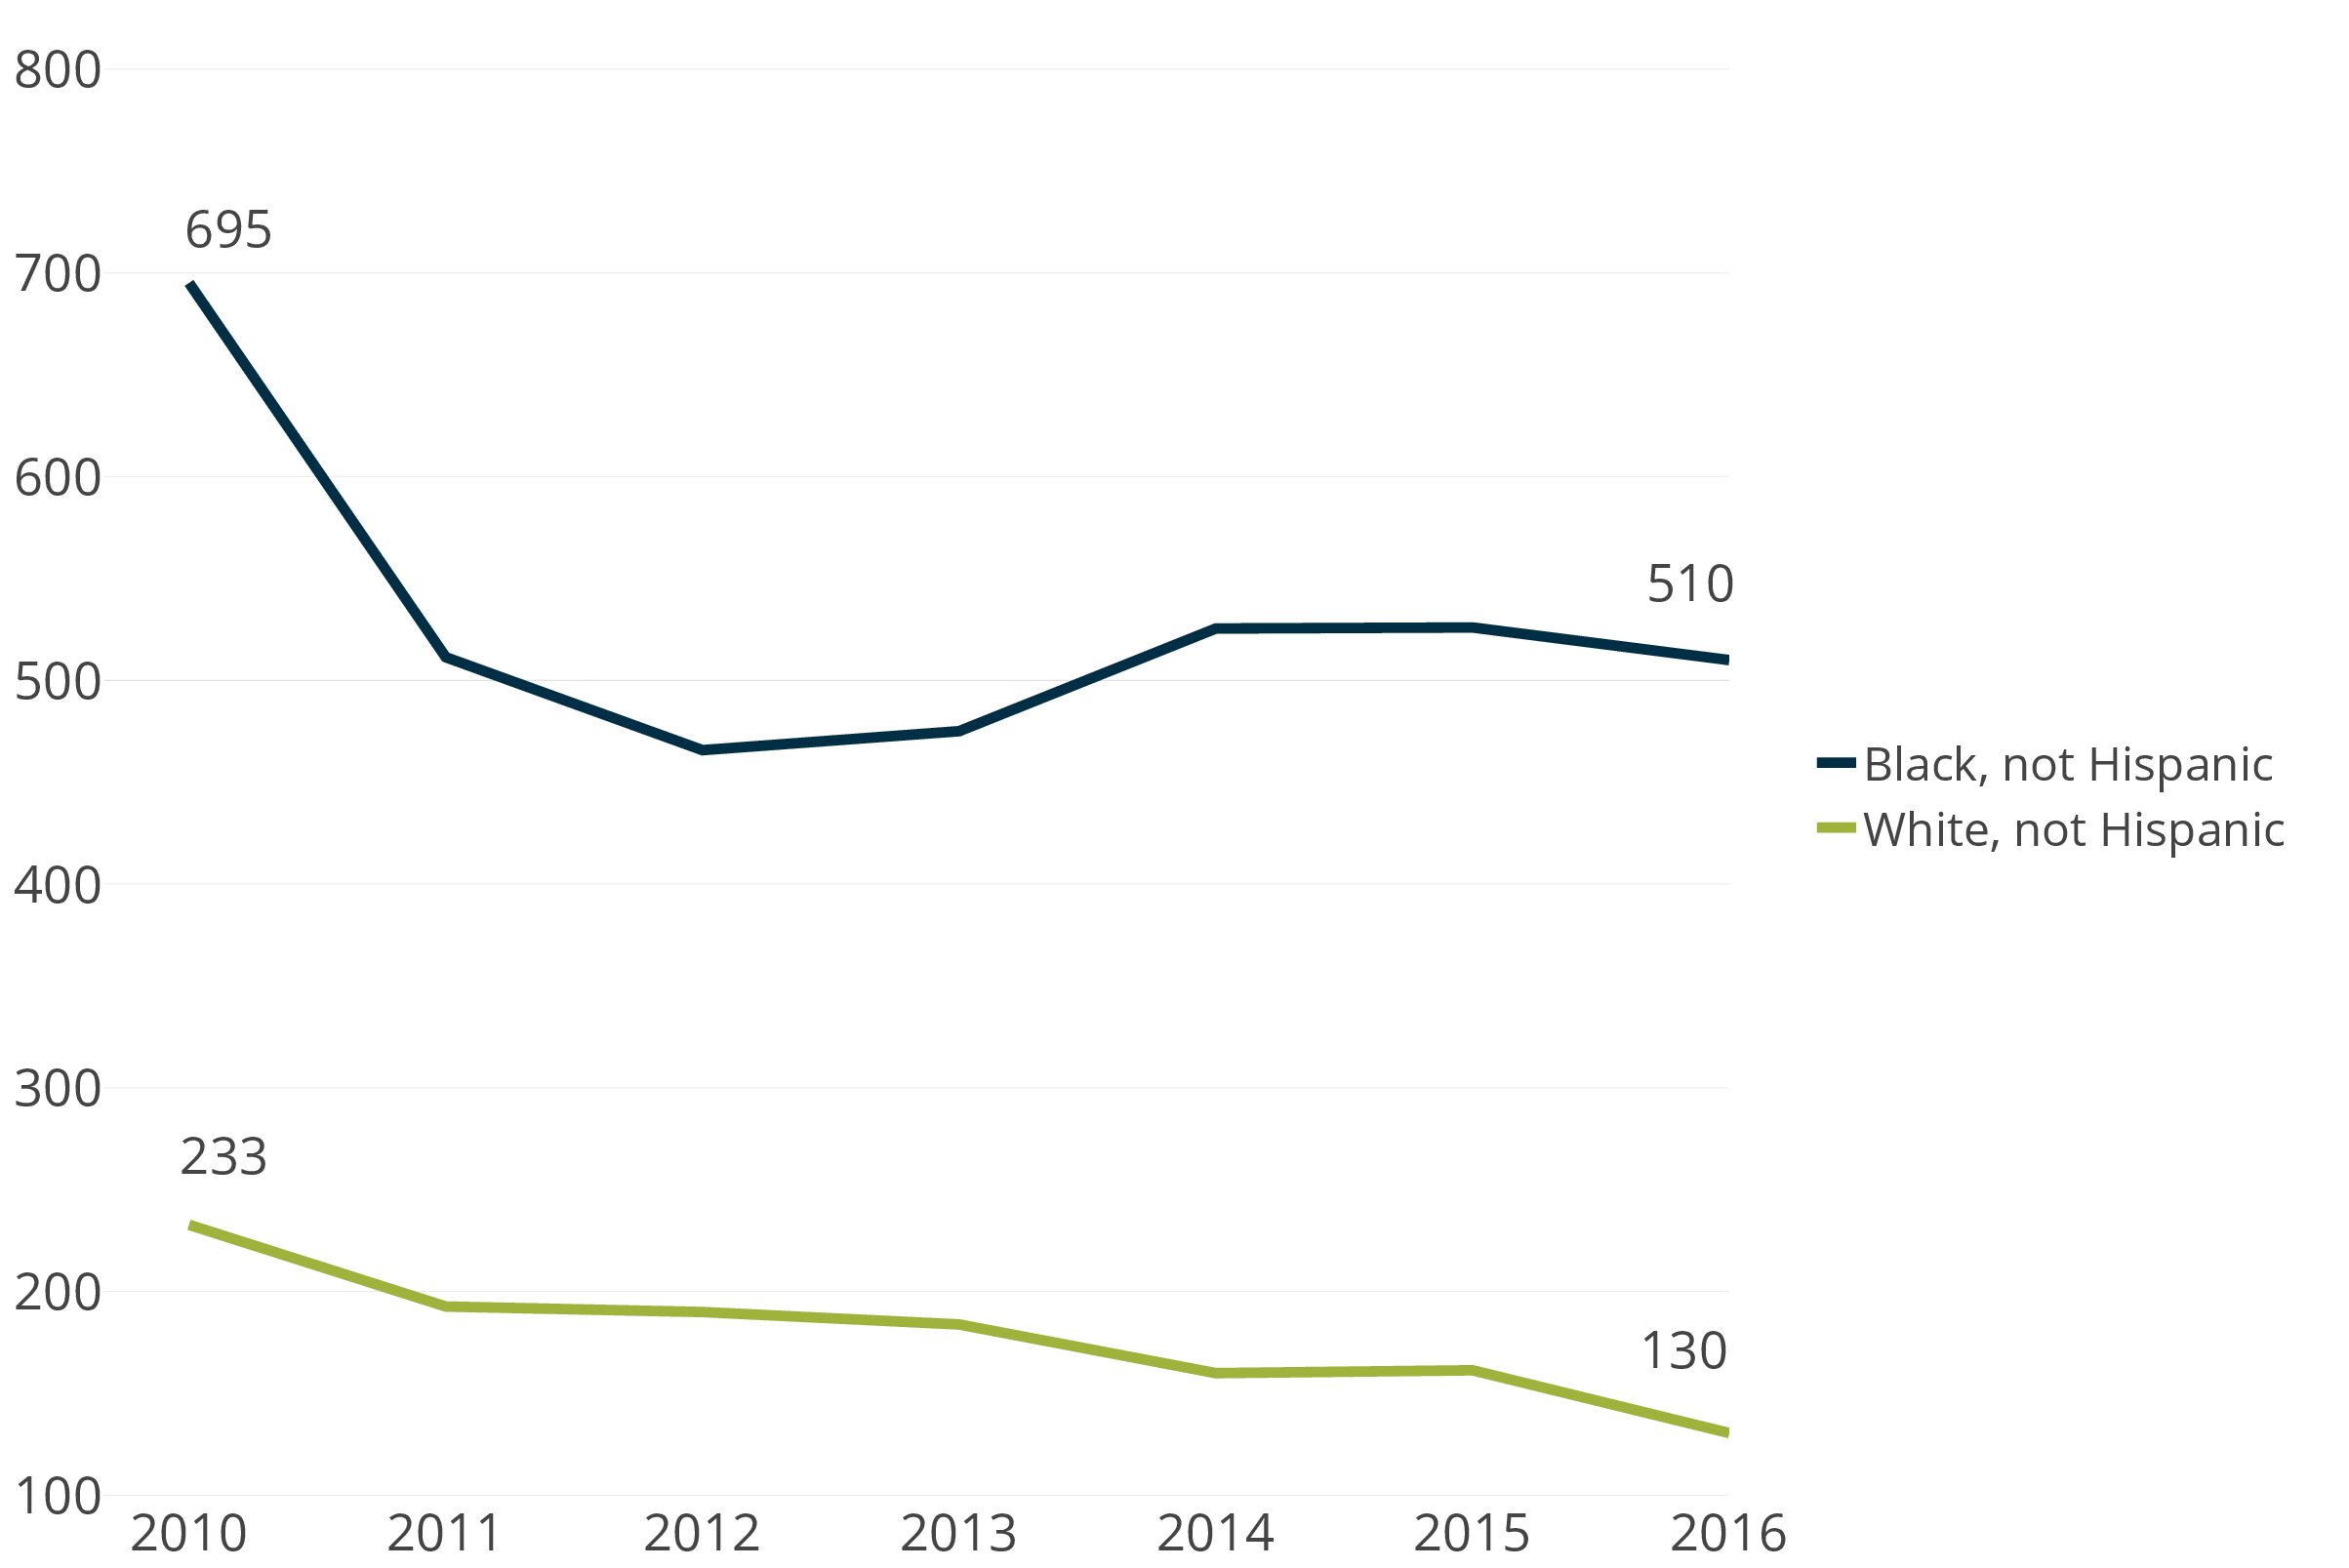
Mortality from cancer, heart disease, and stroke has fallen since 1999, yet blacks are more likely to die from each than whites in New Orleans. Since 1999, there has been a larger decrease in the cancer death rate for the black population of New Orleans (105.5 per 100,000 decrease) than for the white population (69.2 per 100,000 decrease). Also there has been a slightly larger decrease in the heart disease death rate for the black population (97.8 per 100,000 decrease) than for the white population (96.0 per 100,000 decrease). Still, in 2015, African American New Orleanians remained 56 percent more likely to die of cancer or heart disease than white New Orleanians. There has been a larger decrease in the stroke death rate for the white population of New Orleans (32.0 per 100,000 decrease) than for the black population (27.6 per 100,000 decrease). And in 2015, African Americans were 49 percent more likely to die of stroke than whites in New Orleans. Both whites and blacks in New Orleans have experienced an increase in rate of deaths due to accidents (such as traffic fatalities, drowning, falls and other unintentional injuries). Since 1999, the increase in deaths due to accident has been larger for the white population (35.9 per 100,000 increase) than for the black population (14.8 per 100,000 increase). As of 2015, whites had a 31 percent greater chance of death via accident than blacks in New Orleans.
African Americans and whites shared four of their top five causes of mortality: cancer, heart disease, accidents, and stroke. For whites the fifth is Alzheimer’s. For African Americans the fifth is homicide. African Americans in New Orleans were more than nine times as likely to die of homicide (63.8 per 100,000) than whites (6.98 per 100,000) in 2015.41 African Americans were also more likely to die of homicide than accidents (50.0 per 100,000) in that same year. And whites were 78 percent more likely to die of Alzheimer’s (39.2 per 100,000) than black New Orleanians (22.0 per 100,000) in 2015.
Source: CDC.
Notes: Data is categorized by race only, not ethnicity. Thus, Hispanics may be included in counts of whites and blacks.
-
WHY IS THIS IMPORTANT?
Low birth weight is defined as less than 5.5 pounds. Infants born with low birth weights are more likely to experience developmental problems, are more likely to die in the first year of life, and are also more likely to develop diabetes, heart disease, or high blood pressure later in life. Studies have shown that improving the mother’s nutrition and access to prenatal care can help reduce the risk of low birth weight pregnancies.42 However, studies have also shown that racial bias in how medical professionals interact with African American patients—much of it unconscious—results in poorer quality of care for African American patients.43 Moreover, research has determined that birth outcomes are influenced by factors occurring even before pregnancy. Chronic stress associated with racial discrimination over one’s lifetime can increase risk of low birth weight pregnancies.44
HOW IS NEW ORLEANS DOING?
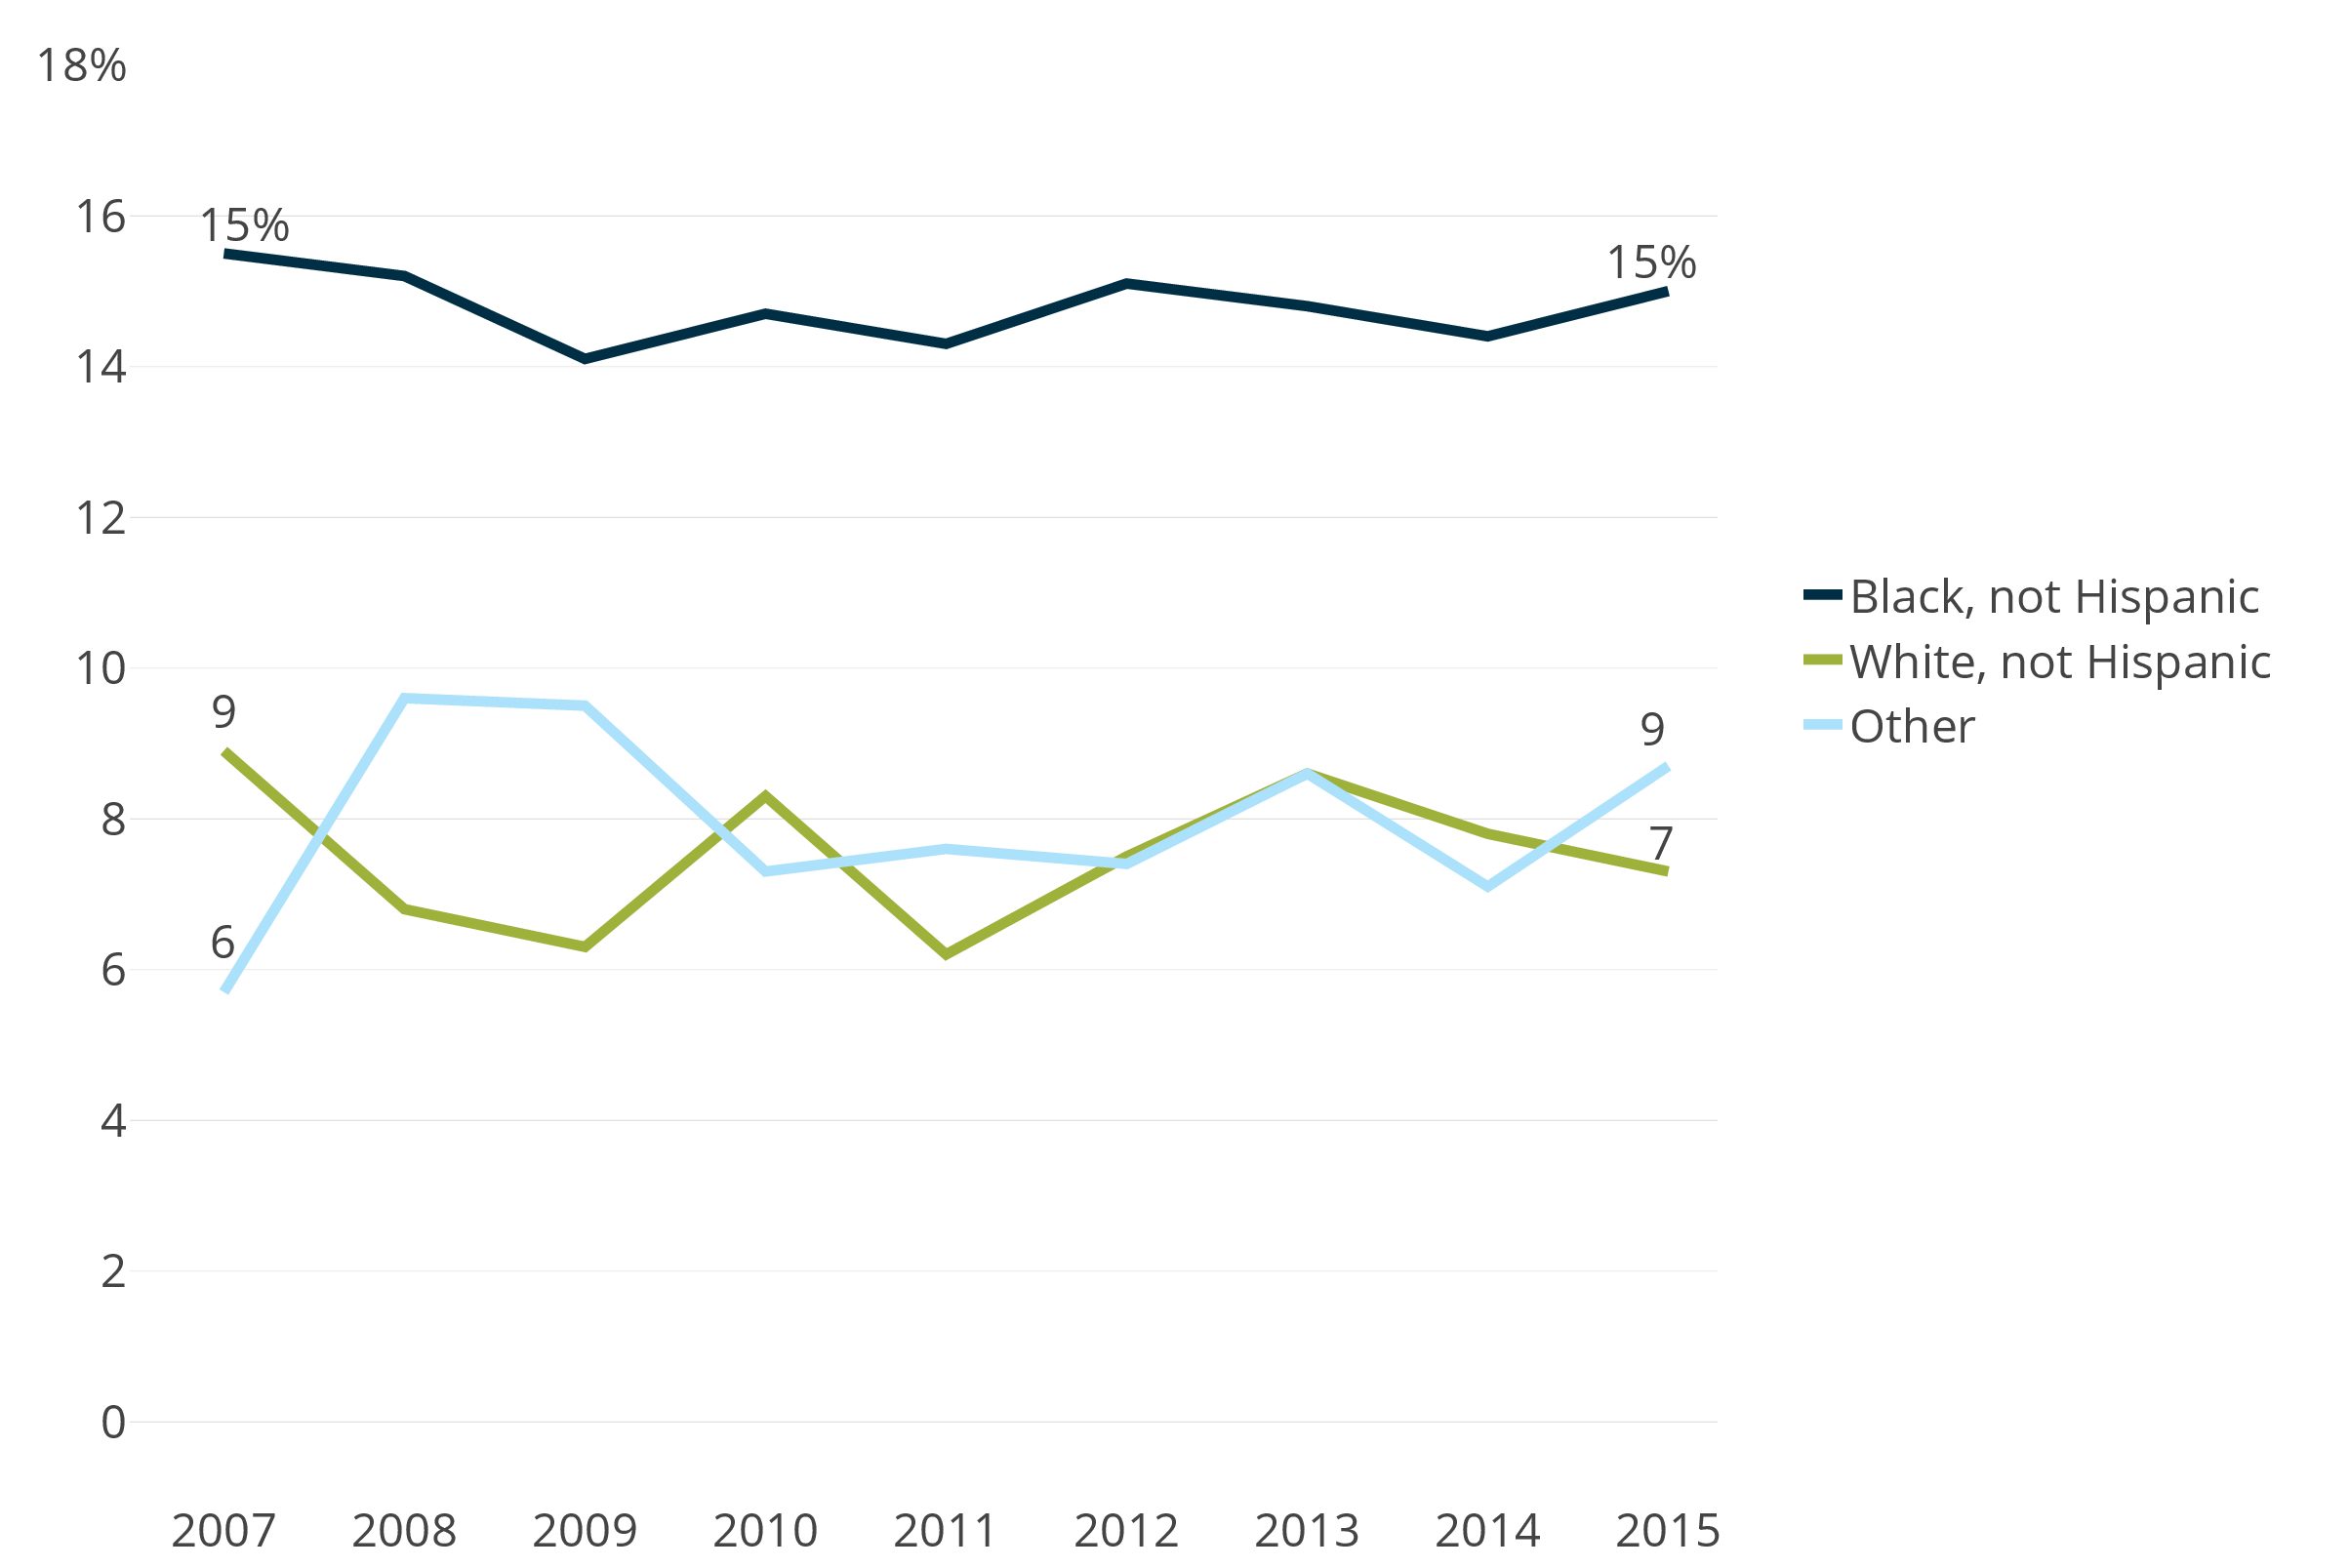
From 2007 to 2015, the share of low birth weight babies born to African American mothers in New Orleans was higher than to white mothers in New Orleans by 6 to 9 percentage points. The share of low birth weight babies born to African American mothers varied from 14.1 percent to 15.5 percent between 2007 and 2015. In contrast, only 6.2 to 8.9 percent of babies born to white mothers during these years were low birth weight.
Among African American women giving birth in 2015 in New Orleans, 11.9 percent of those with a master’s degree or higher had low birth weight babies, compared to 16.2 percent of those with a high school degree or less. Similarly, among white women giving birth in 2015 in New Orleans, 6 percent of those with a master’s degree or higher had low birth weight babies compared to 8.7 percent of those with a high school degree or less. While greater educational attainment decreased the risk of having a low birth weight baby among both African American and white women, vast racial inequity remained. Strikingly, even African American mothers with a master’s degree or higher had a greater likelihood (11.9 percent) of having a low birth weight baby than white mothers with a high school degree or less (8.7 percent).


Education
- Out-of-School Suspensions by Race and Ethnicity
- ACT Scores by Race and Ethnicity
- Adult Educational Attainment by Race, Ethnicity, and Gender
-
WHY IS THIS IMPORTANT
National data shows that racial disparities persist in school suspension rates and that the problem is worse in southern states, including Louisiana.45 A recent comprehensive study by Tulane’s Education Research Alliance found direct discrimination in Louisiana schools in that when a white student and a black student were involved in the exact same incident, the black students received longer suspensions than white students.46 Research has shown that suspensions do not improve overall school safety and are associated with lower academic performance, higher rates of dropout, failures to graduate on time, increased academic disengagement, and subsequent disciplinary exclusions.47 In addition, suspensions correlate with early entry into the criminal justice system.48
HOW IS NEW ORLEANS DOING?
The share of New Orleans’ African American public school students suspended was four to eight times higher than that of white students in data available for the years 2000, 2004, 2009, 2011, and 2013. The share of Hispanic students suspended has been as much as two times higher than white students during these years. In 2000, fully 17 percent of all African Americans students in New Orleans’ public schools were suspended compared with 5 percent of Hispanic students and 4 percent of white students. In 2011, the share of all students suspended swelled, but the share of African American students suspended was highest of all at 21 percent. Among Hispanic students 11 percent were suspended and among whites, 6 percent were suspended that year. As recently as 2013, the share of all students suspended remained high with 17 percent of African American students suspended.

Source: U.S. Department of Education Office for Civil Rights, provided by The Cowen Institute for Public Education Initiatives at Tulane University.
-
WHY IS THIS IMPORTANT?
ACT (American College Testing) scores are designed to indicate a student’s academic college readiness. Notably, academic readiness is considered only one of four important domains of college readiness and should not be thought of as a predictor of college performance.49 ACT is important in Louisiana because students qualify for various award components of the “TOPS” state-sponsored scholarship to Louisiana colleges and universities based in part on their ACT score.50 Currently, a student must score at least a 17 to be eligible for the lowest level “TOPS” award.51 In addition, in Louisiana, an ACT score below 18 is used as an indicator that the student needs remedial college courses.52 The state of Louisiana began mandating that all high school juniors take the ACT exam in 2013.53 When more students take the ACT, the average composite score provides a more comprehensive measure of the graduating class’ academic college readiness.54 Moreover, in Louisiana, the ACT is a particularly valuable longitudinal measure of academic achievement because other state-created tests used in lower grades are subject to changes that make them not useful for measuring progress over time. Race gaps in ACT scores suggest that the education pipeline may be inequitable and may be failing to support overall upward mobility in the region—particularly when larger shares of the population consist of people of color.55
HOW IS NEW ORLEANS DOING?
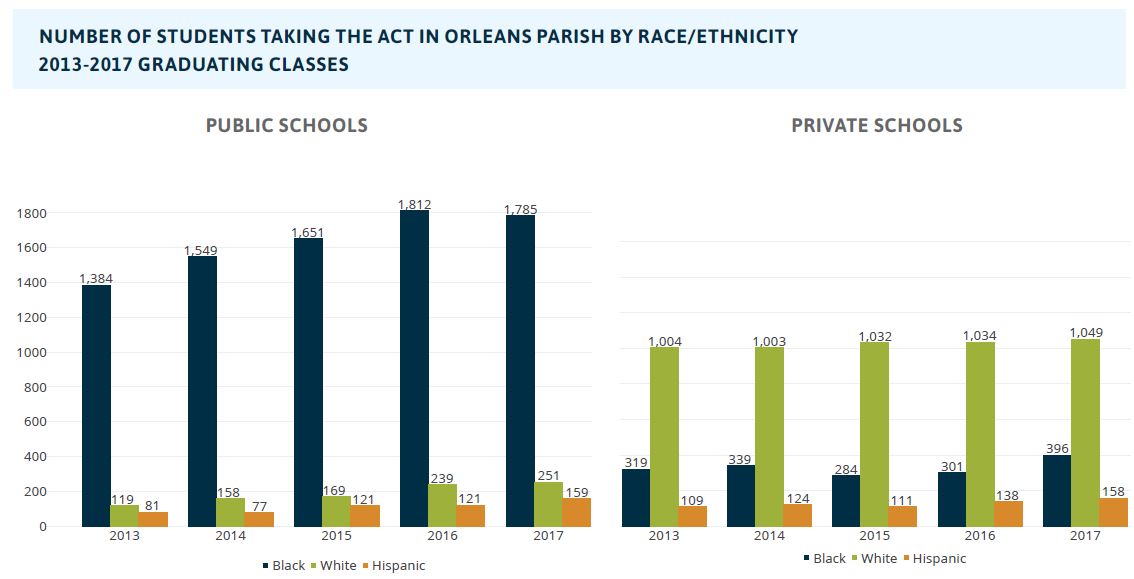
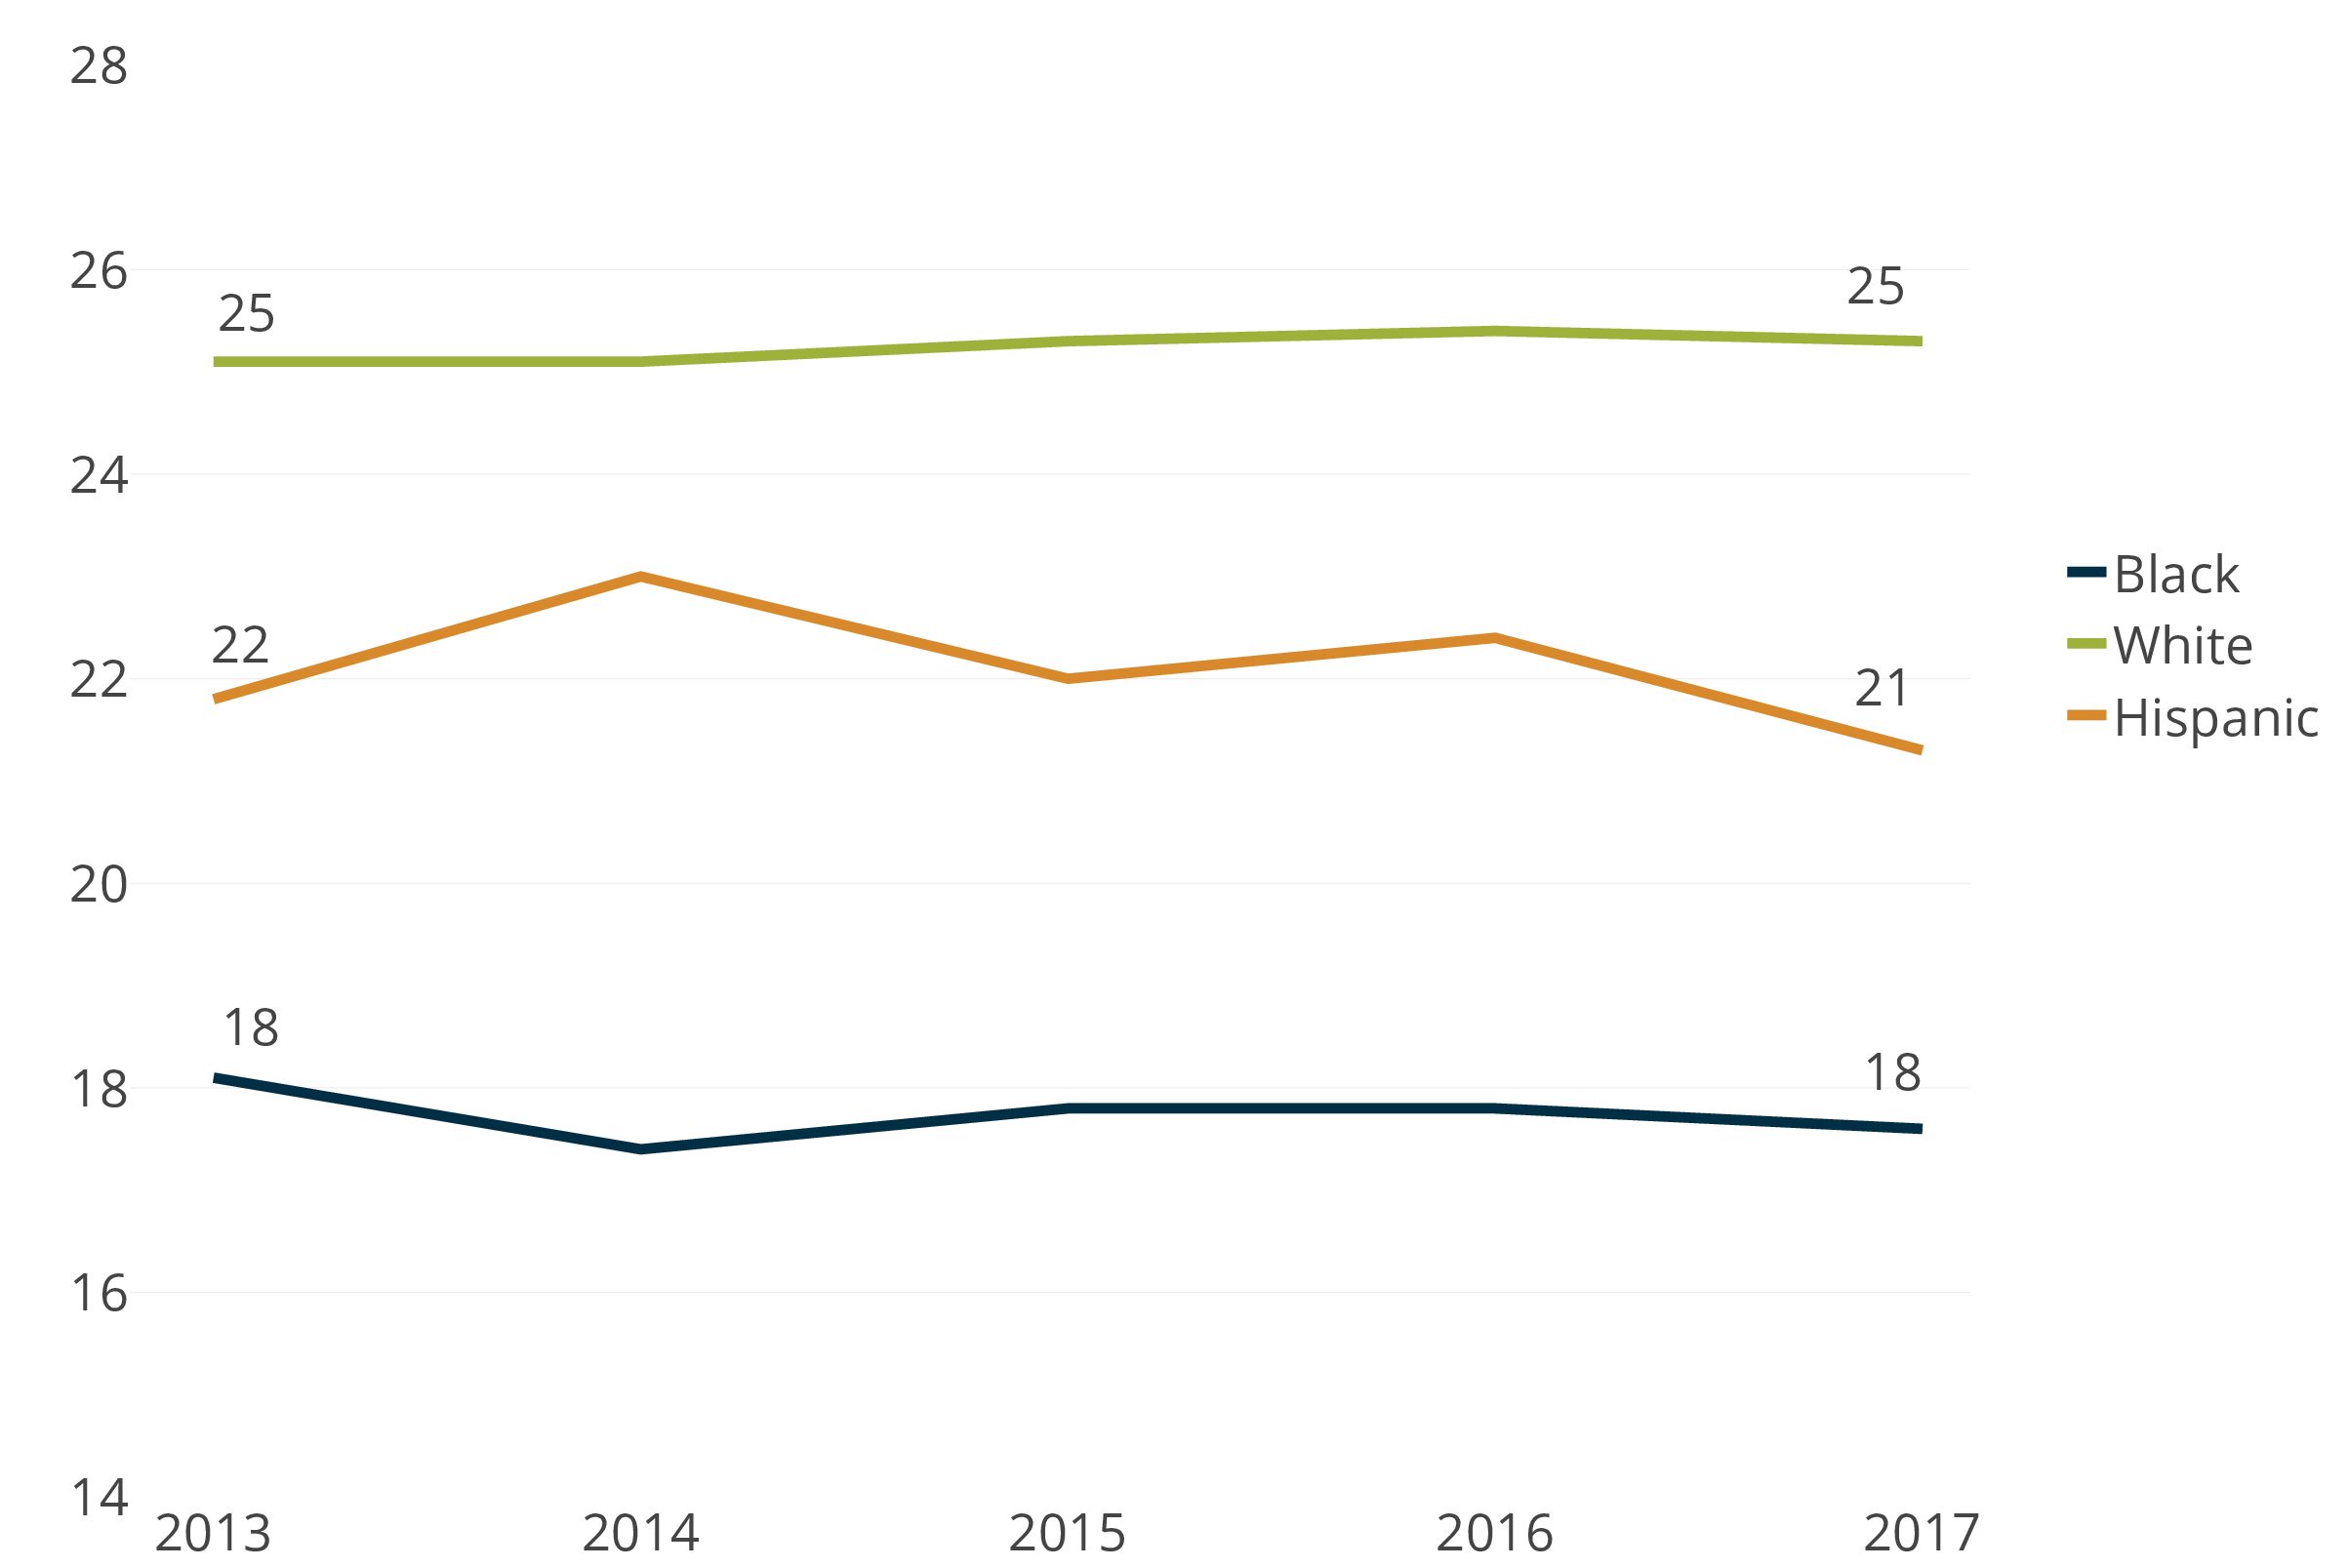
The most recent average composite ACT scores indicate a large racial disparity in our schools’ effectiveness at preparing students for college. Of the 2017 graduating classes from all public and private high schools in New Orleans, African American students averaged 17.6 on the ACT and Hispanic students averaged 21.3. White students averaged 25.3 on the ACT – 44 percent higher than African American students and 19 percent higher than Hispanic students. The number of students taking the ACT in New Orleans has grown from 3,482 students in the graduating class of 2013 to 4,548 students in the graduating class of 2017. Public schools account for the vast majority of the growth in students taking the ACT. As the number grows, the average composite score becomes a more valid indicator of the graduating class’ college readiness.
Source: ACT.
Note: The number of students tested reflects the number of unique students who graduated in that year.
(Data is currently private due to data sharing agreement)
Among the graduating class of 2017 taking the ACT (across public and private schools), 48 percent were identified as African American, 29 percent were white, and 7 percent were Hispanic. Notably, white 2017 graduates taking the ACT were four times more likely to be attending a private school than a public school. Yet whites in public high schools had ACT scores on par with those in private schools— whites at private schools scored 25.3 on average and whites at public schools scored 25.2 on average. In contrast, black students were nearly five times more likely to be attending a public school than a private school. Those attending private schools scored higher than their peers at public schools on average (19.5 and 17.2 respectively). And while Hispanic students attend public and private high schools in equal numbers, those who attend private schools scored much higher on the ACT on average (24.3) than those who attended public schools (18.4).


Source: ACT.
Note: If a student tests more than once, the average composite reflects their latest set of scores.
(Data is currently private due to data sharing agreement)
-
WHY IS THIS IMPORTANT?
There are many reasons why an educated workforce is critical to the long-term economic success of a city. First, educated cities add jobs and population faster than comparable ones with lower education levels.56 Second, wages increase for workers for each additional year of education they accumulate, and that wage premium is increasing over time.57 Between 1973 and 2011, national wages for workers with a college degree rose, while wages for less educated workers stagnated or dropped.58 Third, skilled cities are more resilient to economic shocks because they have the skills and capacity to adapt to change.59
HOW IS NEW ORLEANS DOING?
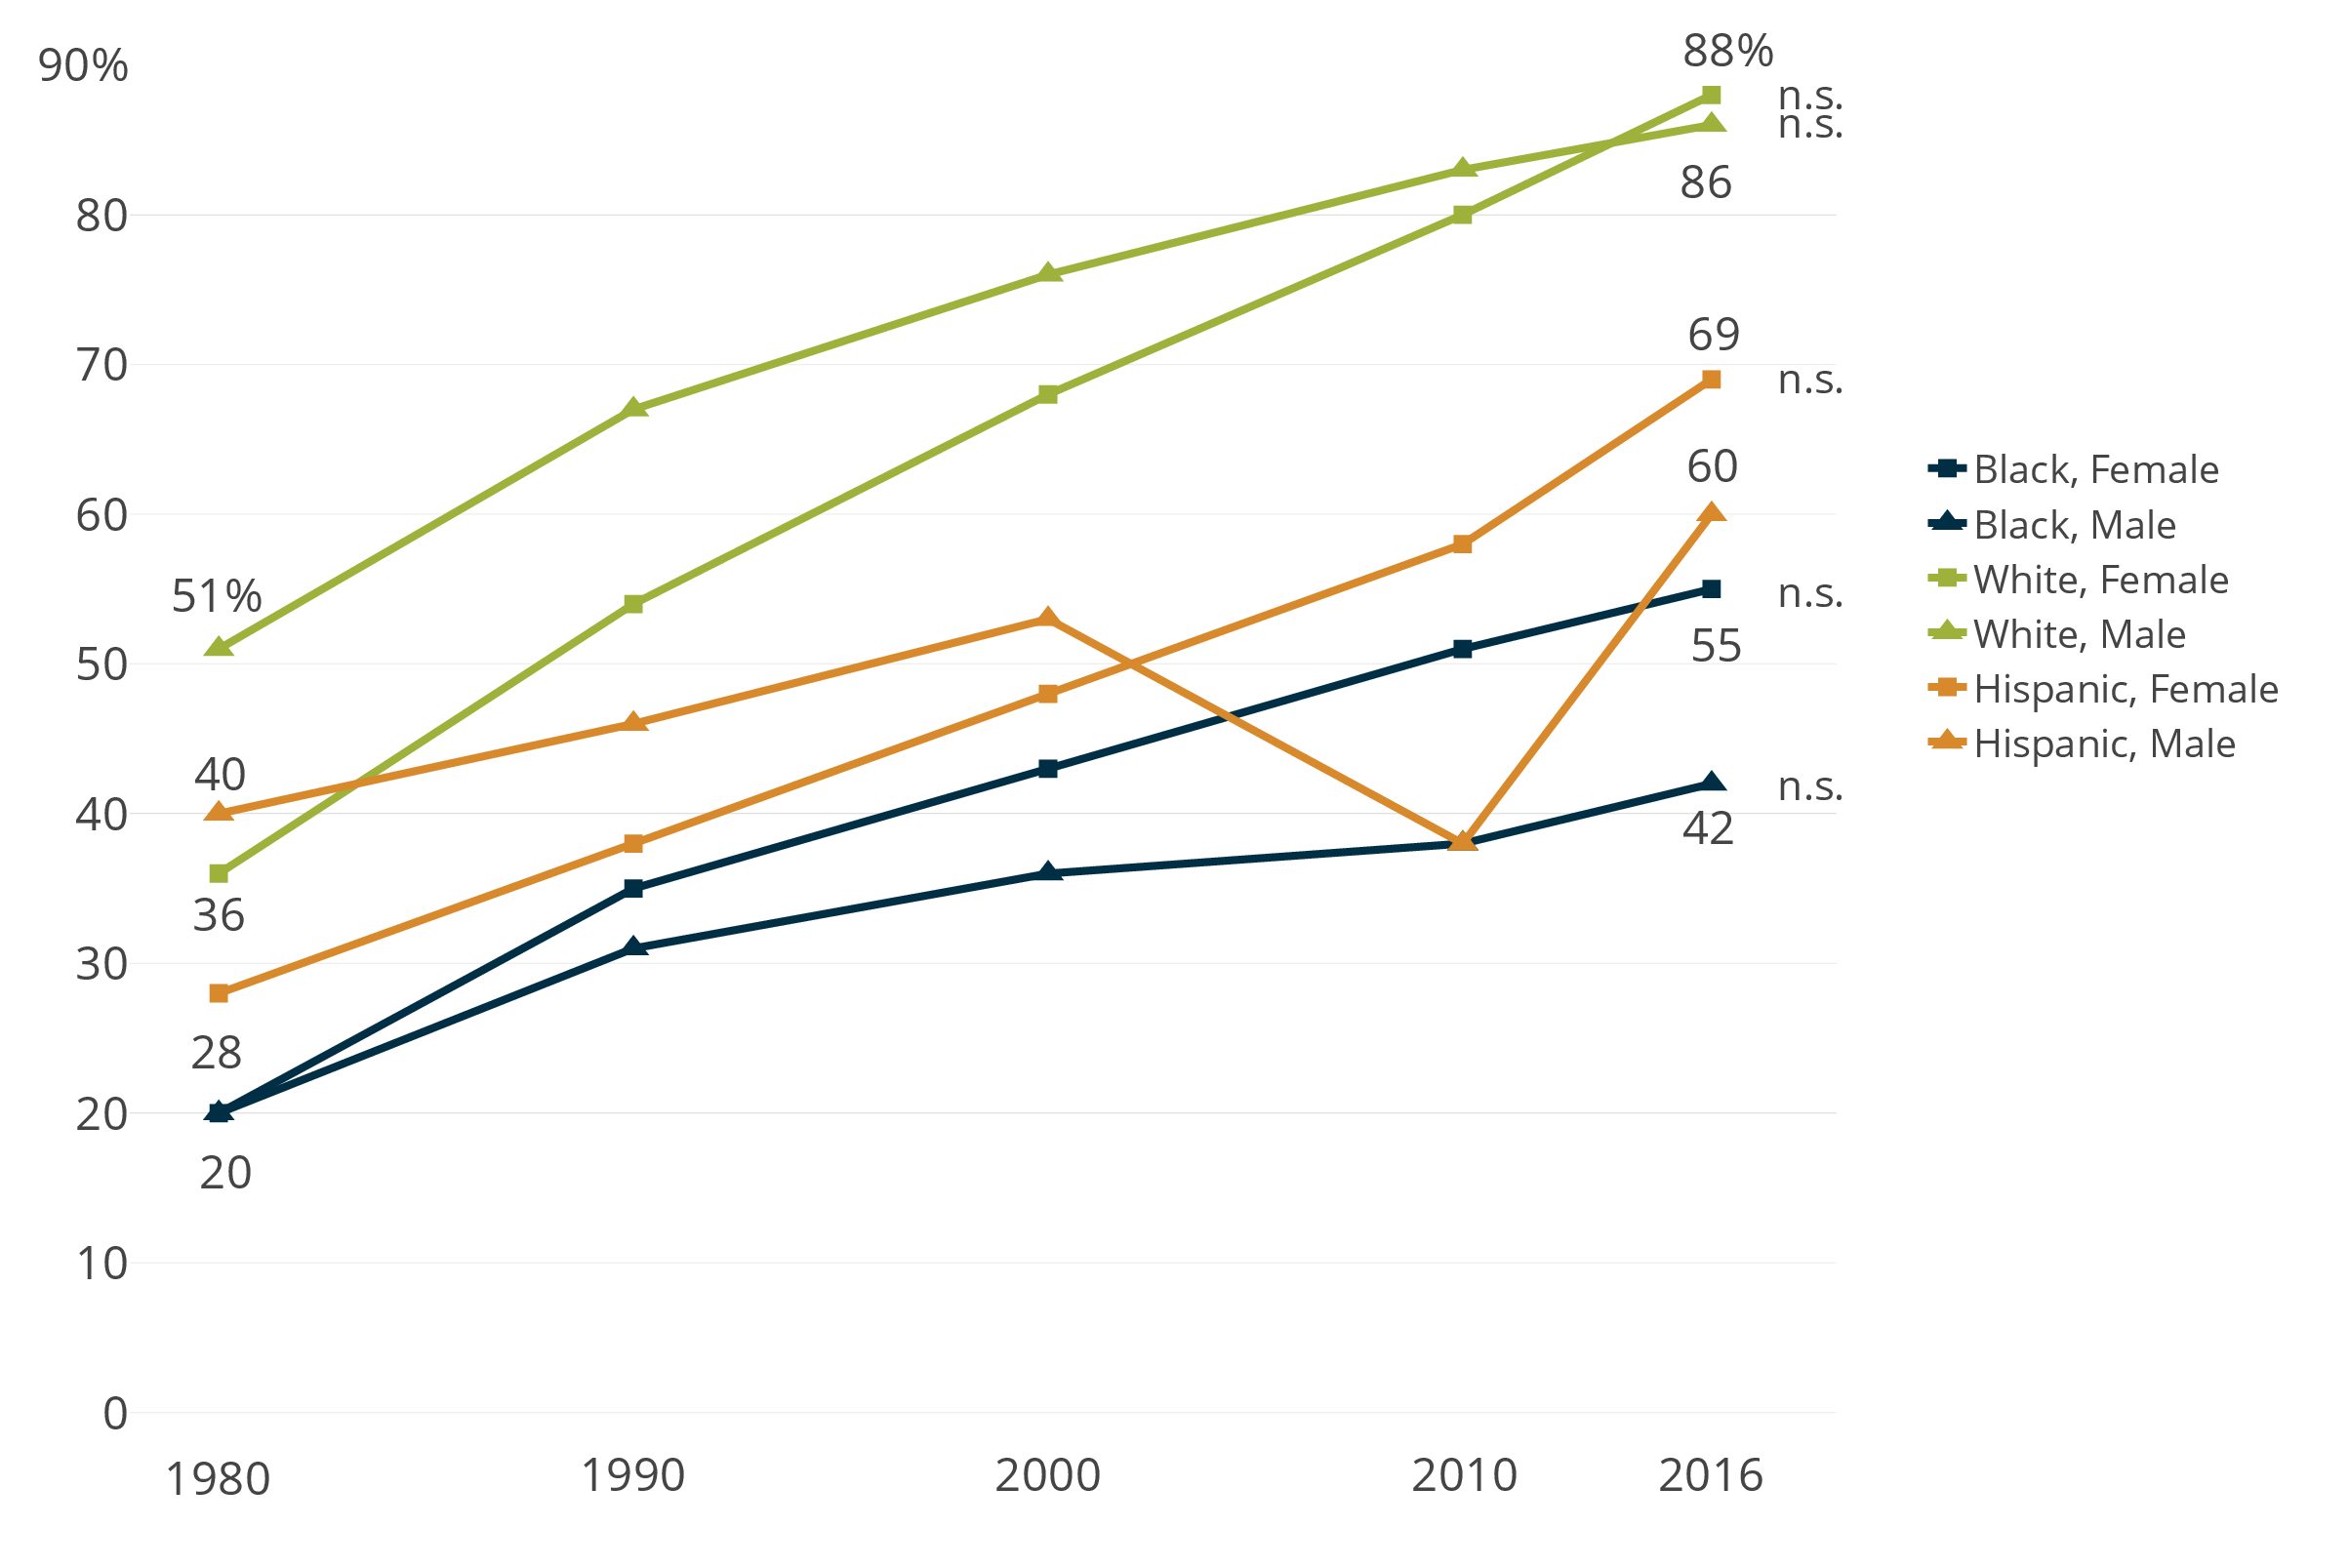
The share of New Orleans adults age 25 and older who have some college education has grown across racial and ethnic groups since 1980. But while more than 85 percent of white adults living in New Orleans have attended college, only 55 percent of black females and 42 percent of black males have attended college as of 2016. Historically, black New Orleanians have been less likely to have some college education than their national peers, and that gap widened for black males in 2016.
Females have experienced substantial growth in college attainment in New Orleans since 1980. The percent of white females with some college education has grown from 36 percent in 1980 to 88 percent in 2016. The share of Hispanic females with some college education has grown from 28 percent in 1980 to 69 percent in 2016. The share of African American females with some college has grown from 20 percent in 1980 to 55 percent in 2016.
Notably, while the share of African American males in New Orleans with some college was on par with African American females in 1980 at 20 percent, by 2016 the share of black males that had some college had grown to only 42 percent and now lags education attainment among black females by 13 percentage points. White adults experienced the opposite trend. The share of white women with some college in 1980 at 36 percent lagged college attainment among white men that year by 15 percentage points, but by 2016 white women had caught up to white men with 88 percent having some college.
The trend among Hispanics is similar to that among whites but possibly for different reasons. In 1980, 40 percent of Hispanic males and 28 percent of Hispanic females had some college. Hispanic females experienced steady growth in their rate of college attainment reaching 69 percent by 2016. The share of Hispanic males with some college, on the other hand, grew to 53 percent in 2000, then fell to 38 percent in 2010 likely due to an influx of lower skilled single Hispanic males assisting in home rebuilding and debris removal. By 2016, the share of Hispanic males with some college grew to 60 percent, as many lesser skilled males likely moved out of New Orleans.


Source: U.S. Census Bureau.
Notes: 1980 data for whites is inclusive of Hispanics (due to data source limitations).
n.s = Difference between U.S. and Orleans is not significant for black females for 2016. Difference between white males and white females is not significant for Orleans Parish for 2016. Change over time is not significant for black males, black females, white males, nor Hispanic females for Orleans Parish for 2010-2016. Change over time is not significant for black males nor Hispanic females for Orleans Parish for 2000-2010.
Criminal Justice
- Jail Incarceration Rates by Race
-
WHY IS THIS IMPORTANT?
Incarceration has enduring economic effects by stifling employment and suppressing labor force participation.60 Many employers will not hire job candidates who have an arrest record—regardless of whether they were ultimately convicted of a crime.61 Also, research has shown that incarceration introduces instability within families that often harms the developmental outcomes of children.62 Incarceration disparities can foster public mistrust of the criminal justice system, which can in turn affect public safety outcomes, as members of the public perceive the system to be unfair and cooperate less with police and other officials.63 Reducing disparities can increase trust in the system and lead to more effective crime prevention. Research suggests that key drivers of racial disparities in jail incarceration rates are discrimination in policing and judicial decisionmaking.64
HOW IS NEW ORLEANS DOING?
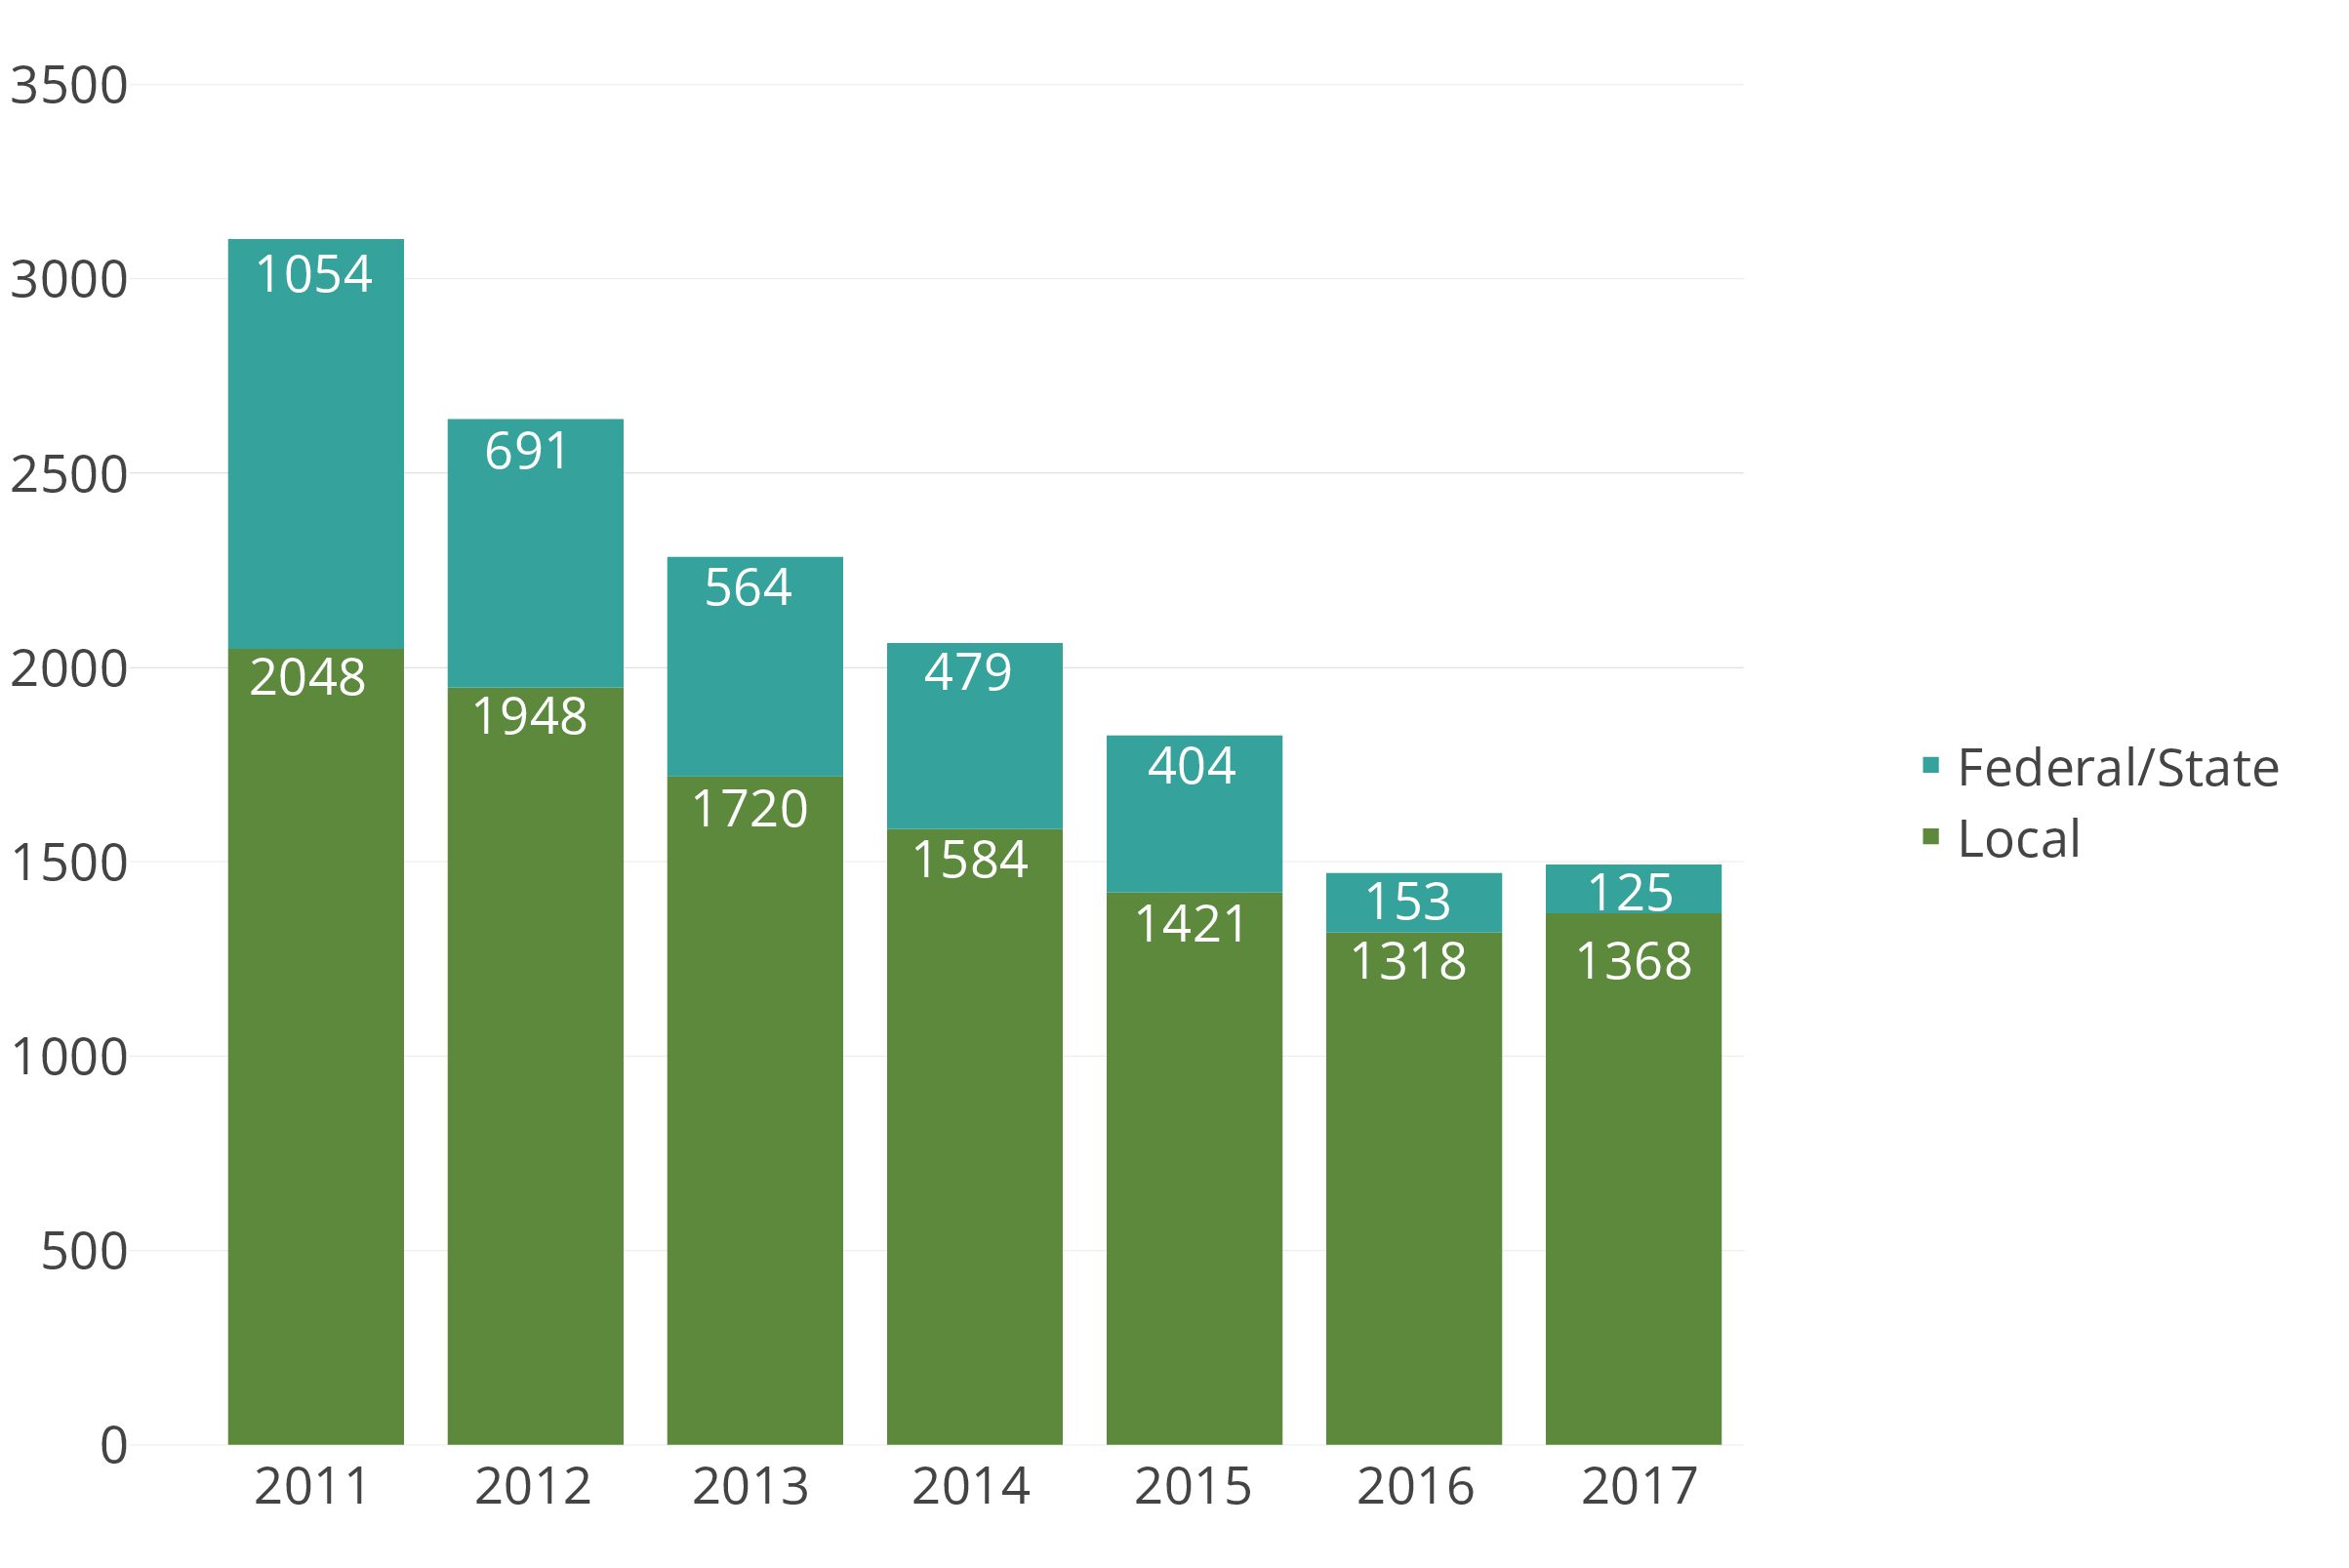
The number of inmates in Orleans Parish Prison (recently renamed the Orleans Justice Center) has fallen substantially from 3,102 on June 30, 2011 to 1,493 on June 30, 2017. However, the majority of those reductions have been due to transferring federal and state prisoners to their respective facilities. The number of local detainees, which is reflective of state policies as well as local policies and practices, fell nearly every year, moving from 2,048 on June 30, 2011 to 1,368 on June 30, 2017. This drop is due to a range of systematic and cultural changes beginning in 2010, including using summons rather than physical arrest, moving misdemeanors from the state court to the local court, developing a pretrial risk assessment system, expanding the use of release on recognizance, and providing for a review on the seventh day when a low risk person is not released.65 Pre-booking deflection practices may reduce local incarceration even further in the future.66
While these changes have reduced jail incarceration rates for both blacks and whites in New Orleans, racial disparities remain extreme. Local detainees in the Orleans Justice Center are nearly four times more likely to be black than white, even after accounting for the larger black population in New Orleans.


Source: City of New Orleans and U.S. Census Bureau.
Notes: See technical notes on page 64 of the report for full definitions of both “local” and “state” persons held in jail. Data is based on an annual snapshot of the jail population on June 30th of each year.