Benchmarks for Blight: How much blight does New Orleans have?
Published: Aug 21, 2012
As of March 2012, there are an estimated 35,700 blighted homes and empty lots in New Orleans, down from 43,755 in September 2010, as indicated by United States Postal Service (USPS) data. The continued reduction in blight since 2010 is attributable to a strong economy and ongoing population growth complemented by the focused efforts of city agencies to bring properties into compliance. However, the City will need to begin coordinating citywide data collection efforts to track blight going forward, as USPS data will provide less reliable indicators over time.
The challenges of measuring blight
Each municipality defines blight differently, and some don’t track blight at all. To be sure, most municipalities have no comprehensive system for counting the number of blighted properties within their boundaries on a regular basis. Only a few, like Cleveland, Ohio, have invested the resources necessary to maintain a data system that tracks blight on an ongoing basis. For this reason, beginning in 2006 the U.S. Department of Housing and Urban Development (HUD) began acquiring quarterly extracts of U.S. Postal Service (USPS) data and publishing this data as a possible indicator of blight and vacancy for cities nationwide.
In September 2010, the USPS counted 43,755 no–stat residential addresses that represent blighted homes or empty lots in New Orleans, as well as 9,356 vacant but habitable residential addresses, and 159,875 active (and likely occupied) residential addresses. Since 2010, the city has continued to experience robust population growth, and over 9,000 additional homes became “active” between September 2010 and March 2012, while the number of vacant units fell by more than 1,000 from 9,356 to 8,008.[1] These numbers indicate that thousands of blighted homes were likely rehabbed and reoccupied between September 2010 and March 2012.
However, in late 2010, the USPS deleted nearly every no–stat residential address from its New Orleans address list leaving the city with no indication of how many blighted homes remain.[2] In March 2011, the number of no–stats suddenly dropped from 43,755 to 1,651. Most observers would agree that in March 2011, New Orleans had well over 1,651 blighted homes still remaining in the city. Indeed in the first quarter of 2011, the City conducted 7,030 code enforcement inspections.[3] The USPS’ decision to delete nearly every blighted home from its address count leaves New Orleans without this helpful indicator of blight, and increases the urgency that the City develop a comprehensive parcel database as well as a process for tracking the status of every property with regularity.
Residential addresses since September 2008, and authors’ estimates since September 2010
New Orleans
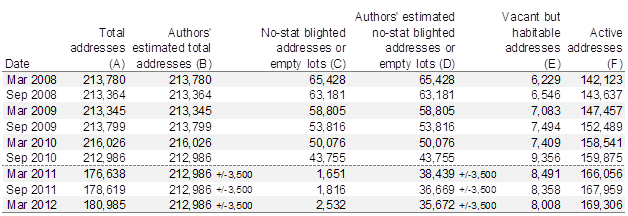
Meanwhile, in this brief we attempt to provide a reasonable range of estimates of the number of “no–stat” addresses that may exist in New Orleans as of March 2012. By holding the number of total addresses constant from September 2010, we can estimate the March 2012 number of no–stats at roughly 35,700.
It is also possible that the number of total address in New Orleans either increased or decreased between September 2010 and March 2012.[4] If we assume that the total number of addresses between September 2010 and March 2012 increased by 3,500 as new residential addresses were added in places like the Warehouse District and the Musician’s Village, then the number of no–stats in March 2012 could have been as high as 39,200. If we assume the total number of addresses decreased by 3,500 between September 2010 and March 2012 as addresses were deleted in places like the former public housing sites that are being rebuilt with fewer housing units, then the number of no–stats in March 2012 could have been as low as 32,200.
What progress has the City made in reducing blight by 10,000?
Only a massive operation that goes door–to–door to inspect every parcel in the city can provide an accurate count of the number of blighted properties in New Orleans. Our estimates suggest that since September 2010 when the Landrieu administration announced a comprehensive strategy to reduce blight by 10,000 properties in three years, the number of blighted homes and empty lots in New Orleans has decreased by somewhere between 4,500 and 11,500 (as of March 2012). In other words, at a minimum, the City seems to be nearly on target for reaching its goal—and may even be doing quite a bit better than meeting its target. But there’s no doubt that the most important factor that is driving blight reduction is population growth.
Between 2010 and 2011, the number of “active” addresses grew by over 8,000 (or 5 percent — which coincides with the Census Bureau’s estimated 5 percent population growth rate between 2010 and 2011). The New Orleans metro’s relatively strong economy has been a critical factor in attracting new and returning residents.[5] And Orleans Parish seems to be attracting most of these residents.[6]
The City’s Rental Rehab program and First Time Homebuyer program contribute to this growth by subsidizing the rehab of rentals and damaged homes for new occupants. But with 431 rentals rehabbed and 31 homebuyers assisted in 2011, the scale of these programs is not adequate to remediate a sizable portion of the blighted properties in New Orleans. The City’s code enforcement department conducted 23,000 inspections in 2011 and brought more than 2,300 properties to code enforcement hearings. Nearly 800 of these properties were brought into compliance via these hearings, and many more may have come into compliance simply through the threat of code enforcement hearings.[7] While coming into compliance is critically important for remediating blight in the city, these properties can quickly come into disrepair again if they are not inhabited. The most recent data on active addresses suggests that the population of New Orleans grew between 2011 and 2012, but at only half the pace as the year before.[8] This suggests that blight reduction may become more difficult in the future.
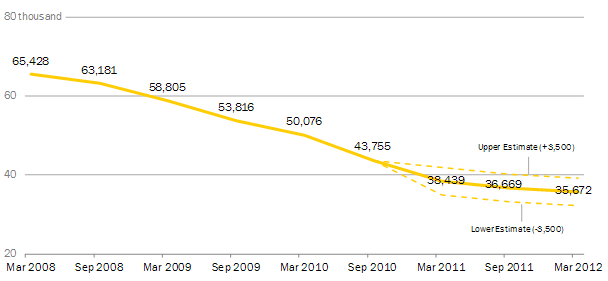
Indeed, if we graph the middle estimate for no–stat addresses after September 2010, it appears that blight reduction has slowed considerably compared with the previous three years. No doubt, the main driving force behind the reduction in blight since 2008 was the billions of federal dollars distributed to New Orleans homeowners through the Road Home program. Nearly 42,000 homeowners in New Orleans received Road Home Option 1 grants (intended to rebuild and reoccupy their storm–damaged home).[9] Ensuring that all of these homeowners have actually rebuilt and reoccupied their homes according to the covenants of their grant will be critically important to furthering blight reduction efforts.
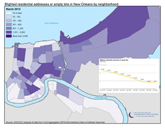
Blighted residential addresses or empty lots
New Orleans
How do these numbers compare to other cities?
Other cities have not seen the large–scale deletion of no–stat addresses by the USPS that New Orleans has. For this reason, we can continue to look at USPS data as a reasonable indicator of blight and vacancy in other cities. In recent years, cities like Baltimore, Cleveland, and Detroit have been ravaged by foreclosures leaving scores of vacant properties in their wake. In many such cities, a growing number of properties are classified by the USPS as “vacant,” meaning they are likely habitable but unoccupied. Increases in vacancies are very worrisome because they suggest a weak market for properties and are the precursor to blight. In fact, most U.S. cities that are experiencing a growing number of vacancies are also experiencing a growing number of blighted homes.
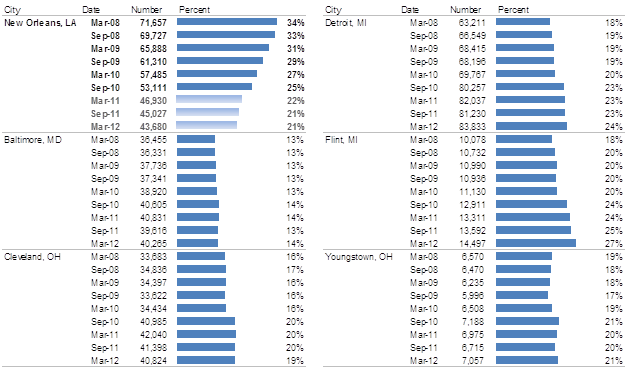
To compare New Orleans to other cities, we examine the total number of unoccupied residential units by adding together no–stat and vacancy counts. We find that the estimated share of total residential addresses that are unoccupied has fallen dramatically in New Orleans since March 2008 when it was 34 percent. In contrast, the share of unoccupied residences in many other cities has grown since March 2008. Nonetheless, New Orleans’ share is still unacceptably high with a mid–point estimate of 21 percent of all residential addresses.
Unoccupied residential addresses
Blighted addresses or empty lots plus vacant but habitable homes, select cities
Conclusion
No doubt the City’s intensive efforts since September 2010 have contributed to the blight reduction witnessed to date. It will be critical that the City maintain this level of effort so that property owners are motivated to maintain their properties, whether or not they are inhabited. But sustainable blight reduction may become more difficult in the future if population growth slows.
Expanding the footprint of responsible property owners through programs akin to the Lot Next Door will be critical blight elimination tools in neighborhoods with weak market demand.[10] Similarly, converting empty lots into water retention areas, such as rain gardens and bioswales, can serve the multiple purposes of eliminating blight, beautifying neighborhoods, and reducing flood risk.[11]
Appendix A: About this data source/ Methodology
In 2006, the U.S. Department of Housing and Urban Development (HUD) began acquiring quarterly extracts of U.S. Postal Service (USPS) data and publishing this data as a possible indicator of blight and vacancy for cities nationwide. In this report, addresses coded as “no–stat” in the HUD data are used as proxies for blighted housing units in New Orleans because a parcel–by–parcel census of all properties in New Orleans is not available. “No–stats” are addresses identified by the USPS letter carrier as uninhabitable and not likely to receive mail for some time (e.g., blighted housing units, empty lots, buildings under construction and not yet occupied, and rural route addresses vacant for 90 days or longer). In the parishes affected by Hurricanes Katrina and Rita, no–stat addresses include heavily damaged homes that have not been re-occupied. In this report, addresses coded as “vacant” in the HUD data are used as proxies for vacant but habitable housing units. “Vacants” are addresses identified by the letter carrier as habitable but without mail pick up for 90 days or longer. To learn more about how the HUD data compares to other sources of USPS data, see Appendix B in the downloadable report.
In late 2010, the USPS deleted nearly every no–stat residential address from its New Orleans address list, leaving the city with no indication of how many blighted homes remain. In March 2011, the number of no-stats suddenly dropped from 43,755 to 1,651. In this report we attempt to provide a reasonable range of estimates of the number of no–stat addresses in New Orleans. For example, our mid–point estimate for March 2012 is arrived at by subtracting the total number of addresses in March 2012 from the total number of addresses in September 2010 at the census tract–level, then adding in the number of no–stat addresses provided by USPS for March 2012 for that census tract. (For census tracts where the difference between March 2012 and September 2010 total addresses was negative, then we simply used the number of no–stat addresses provided by USPS for March 2012 as the estimate of blighted addresses and empty lots for that census tract.) Finally, we summed the census tract estimates to arrive at the mid–point estimate for the City of New Orleans.
[1] U.S. Census Bureau. (2012). Texas dominates list of fastest–growing large cities since 2010 Census, Census Bureau reports. Retrieved July 12, 2012 from http://www.census.gov/newsroom/releases/archives/population/cb12-117.html.
[2] The elimination of no–stats in New Orleans was not discovered until June 2012, when HUD began making USPS data available after a nearly two year delay. This delay was due to a lapse in HUD’s contract with the USPS. That contract lapsed in late September 2010 and was not renegotiated until 2012. Subsequently, HUD received no data from the USPS after September 2010 until June 2012. In June 2012, HUD made available quarterly USPS data covering December 2010 through March 2012.
[3] City of New Orleans Office of Performance and Accountability. (2012). ResultsNOLA. Retrieved August 1, 2012 from http://www.nola.gov/sitecore/content/Root/GOVERNMENT/Chief-Administrative-Office/Office-of-Performance-and-Accountability/ResultsNOLA.aspx.
[4] Between March 2008 (when HUD first began reporting the USPS total number of residential addresses) and September 2010, the total number of addresses in New Orleans varied from a high of 216,192 in June 2010 to a low of 212,647 in June 2008 — a difference of 3,545. This 1.6 percent variation is roughly in line with the variance in total addresses in most other large U.S. cities.
[5] The 7–parish New Orleans metro area includes Jefferson, Orleans, Plaquemines, St. Bernard, St. Charles, St. John the Baptist, and St. Tammany. While the U.S. shed 3.2 percent of its jobs between May 2008 and May 2012, the New Orleans metro economy actually grew jobs by 0.8 percent during the same period.
[6] Ortiz, E. & Plyer, A. (2012). Neighborhood Growth Rates. Greater New Orleans Community Data Center. Retrieved August 1, 2012 from https://gnocdc.s3.amazonaws.com/reports/GNOCDC_NeighborhoodGrowthRates.pdf.
[7] City of New Orleans Office of Performance and Accountability. (2012). ResultsNOLA. Retrieved August 1, 2012 from http://www.nola.gov/sitecore/content/Root/GOVERNMENT/Chief-Administrative-Office/Office-of-Performance-and-Accountability/ResultsNOLA.aspx
[8] Ortiz, E. & Plyer, A. (2012). Neighborhood Growth Rates. Greater New Orleans Community Data Center. Retrieved August 1, 2012 from https://gnocdc.s3.amazonaws.com/reports/GNOCDC_NeighborhoodGrowthRates.pdf.
[9] State of Louisiana Office of Community Development. (2012). The Homeowner Assistance Program Week 315 Situation & Pipeline Report. Retrieved August 1, 2012 from https://www.road2la.org/Docs/pipeline/week315pipeline.pdf.
[10] Plyer, A., Ortiz, E., & Pettit, K. (2010). Optimizing Blight Strategies. Greater New Orleans Community Data Center. Retrieved August 12, 2012 from https://www.datacenterresearch.org/reports_analysis/optimizing-blight-strategies/.
[11] Brown, D.N. (n.d.). Low Impact Development: Living With Water. Dana Brown & Associates, Inc. Retrieved August 9, 2012 from http://www.deq.louisiana.gov/portal/Portals/0/envirothon/Envirothon-Low%20Impact%20Development.pdf.