Changing New Orleans Neighborhoods
Published: Sep 14, 2021
The population of New Orleans grew from 343,829 in 2010 to 383,997 in 2020—an increase of 11.7 percent which was well above the national population growth rate of 7.4 percent. Much of the population growth in New Orleans was likely due to the continuing post-Katrina recovery in the early part of the decade. In fact, year-by-year estimates from the Census Bureau suggest the city’s population may have reached a peak mid-decade and begun to decline slightly in the last few years.
In contrast to estimates, which are only available for the city as a whole, the once-every-ten-year Census headcount gives a glimpse of population changes at the neighborhood level. This brief covers neighborhood population recovery rates since 2000—before Hurricane Katrina struck and the federal levees failed, flooding some 80 percent of the city. It also quantifies neighborhood level changes from 2010 to 2020 to highlight where more recent growth or population loss has occurred, and the racial dynamics of those recent changes. The 2020 data released last month also provides total counts of children by neighborhood which can be helpful for locating the services children will need as New Orleanians struggle to recover from their most recent disasters—the COVID-19 pandemic and Hurricane Ida.
According to the 2020 Census, New Orleans has only 79 percent of its pre-Katrina total population, with some neighborhoods shrinking and some growing.
Only five neighborhoods have less than half the population they had prior to Hurricane Katrina, including four that encompass former public housing sites being redeveloped as mixed-income housing: Florida Development, B.W. Cooper Apts., Iberville, and St. Bernard Area. The Lower Ninth Ward, where the surge of water was so strong it knocked homes completely off their foundations, also has less than half the population it had prior to Hurricane Katrina.
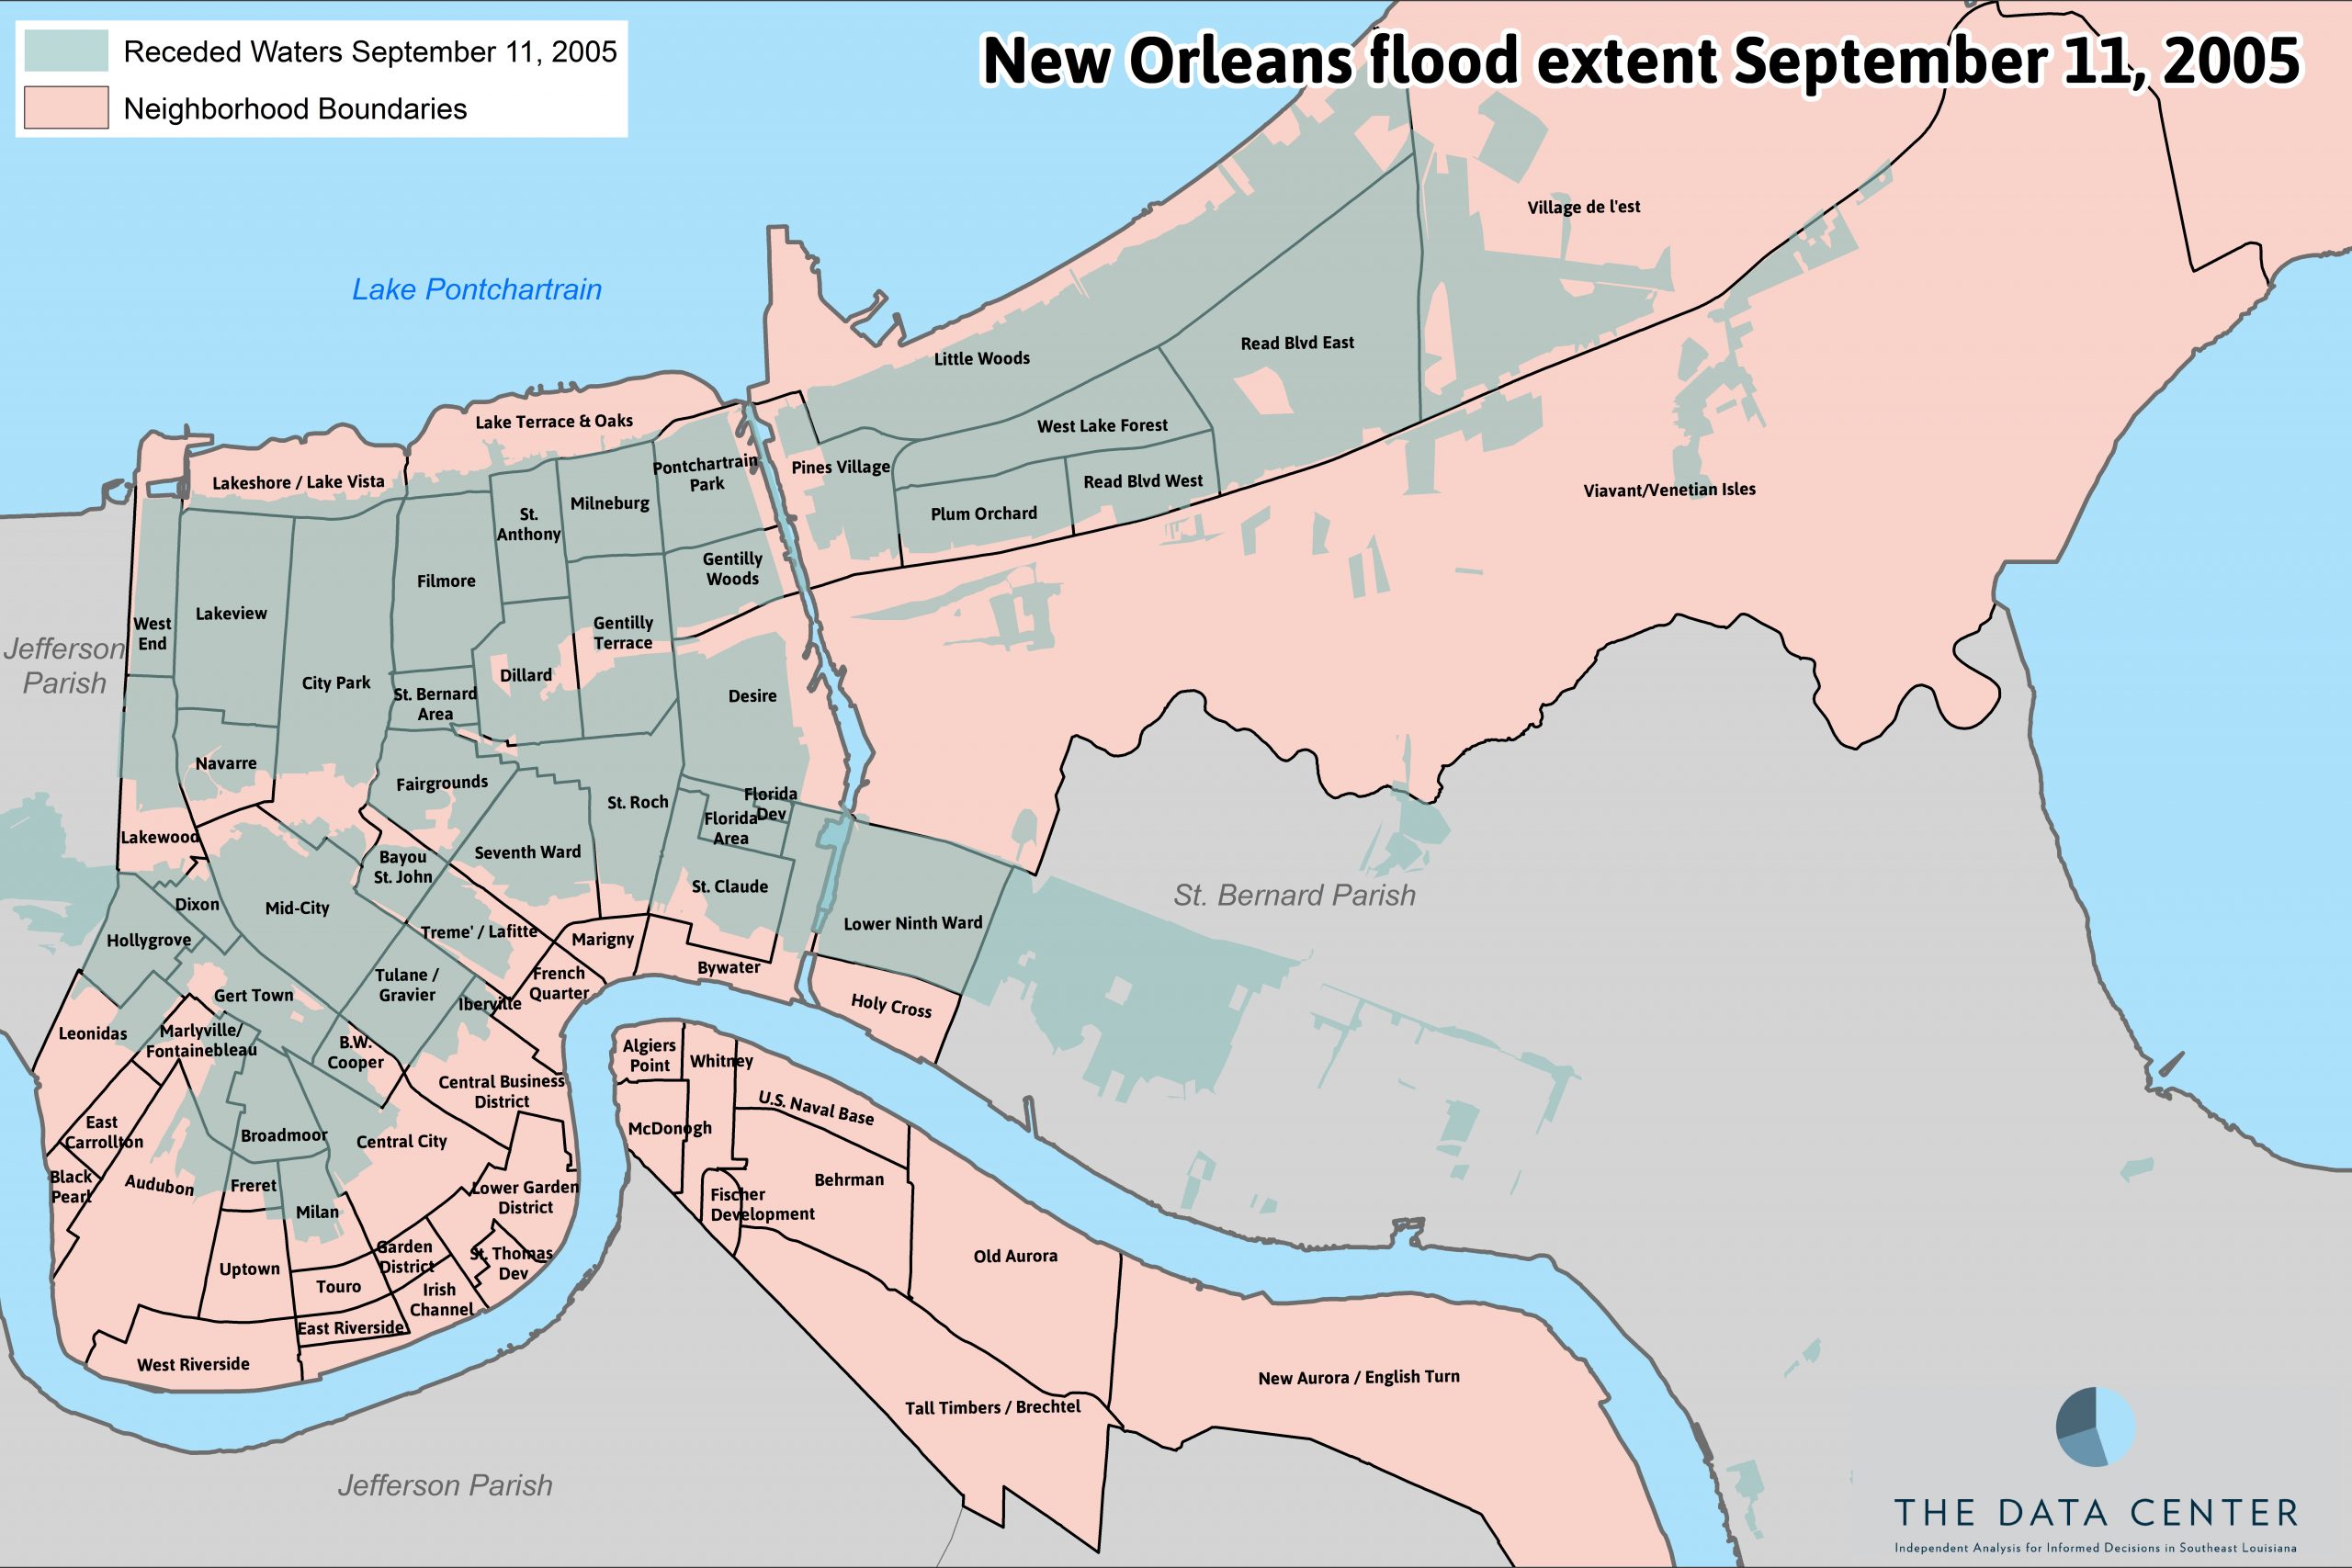
Other neighborhoods that flooded are among those with lower population recovery compared to 2000 before Hurricane Katrina hit. West Lake Forest, Florida Area, Viavant/Venetian Isles, St. Roch, Holy Cross, St. Claude, Seventh Ward, Tremé/LaFitte, Desire, Freret, and Village de l’Est all have between 50 and 70 percent of the residents they had in 2000. In the case of Village de l’Est a portion of this difference is due to a census tract boundary change (described below) which caused the northern portion of Village de l’Est residents to be counted in the new Lake Catherine/Village de l’Est neighborhood. Among sites of former public housing projects that are being redeveloped as mixed-income housing, only the St. Thomas Development has resident totals as high as 77.6 percent of its 2000 total.
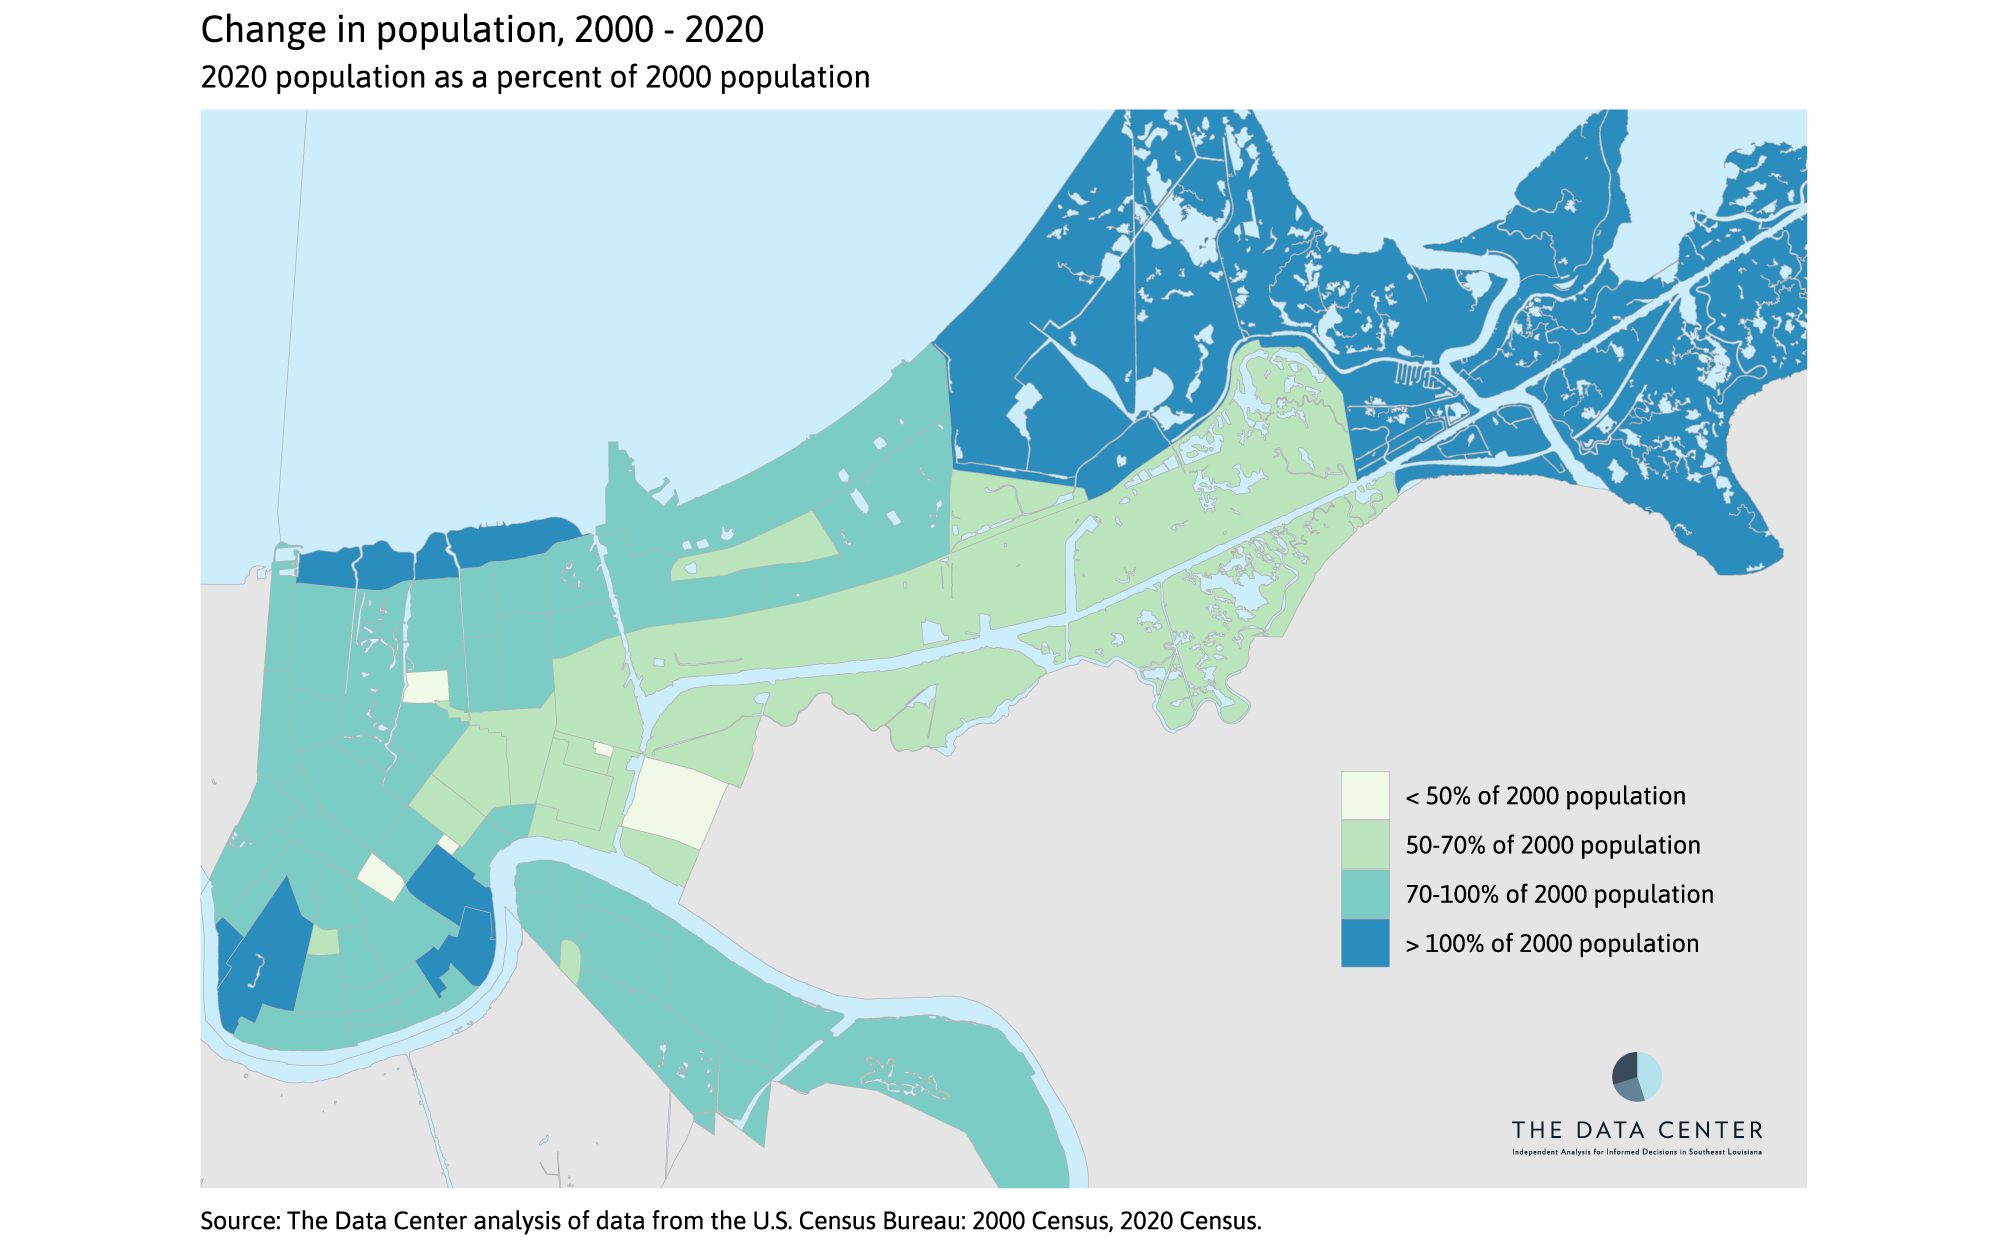
Sixteen years after Hurricane Katrina, seven of New Orleans’ 72 neighborhoods actually have larger populations than they did in 2000. These include the Lower Garden District and the Central Business District which together encompass the “Warehouse District” where many commercial buildings have been redeveloped to apartments and condo buildings. Audubon and Lake Terrace & Lake Oaks both experienced significant population growth driven almost entirely by increases in students living in group quarters at Tulane University, Loyola University, and University of New Orleans, which we document in our upcoming brief on group quarters populations. Black Pearl and Lakeshore/Lake Vista experienced modest population growth. The Census Bureau changed the boundary of the census tract which previously represented Lake Catherine, such that it now encompasses a part of the Village de l’Est neighborhood. Because of (and only because of) this boundary change, this neighborhood counts as one of the seven that has experienced population growth since 2000.
From 2010 to 2020, New Orleans’ population grew 12 percent, with growth skewed toward neighborhoods that flooded during Katrina, as residents continued to rebuild.
Given their significant population loss after the 2005 levee failures, by 2010 (five years after Hurricane Katrina) several neighborhoods that flooded had very little population. Thus, from 2010 to 2020, 9 of the 10 neighborhoods that had the largest population growth were among those that flooded. Little Woods, Lakeview, Central City, Lower Ninth Ward, St. Bernard Area, Filmore, Tremé/Lafitte, West End, and Plum Orchard each had population growth between 1,400 and 4,800 residents as these neighborhoods continued to rebuild. Notably, despite the fact that St. Bernard Area, Tremé/Lafitte, and Lower Ninth Ward gained the most residents between 2010 and 2020, they still have less than 70 percent of the residents they had in 2000 before Hurricane Katrina. The Central Business District also ranked in the top 10, gaining over 2,000 residents between 2010 and 2020. Fully 51 neighborhoods gained population between 2010 and 2020. Nearly all of them flooded following the levee failures.
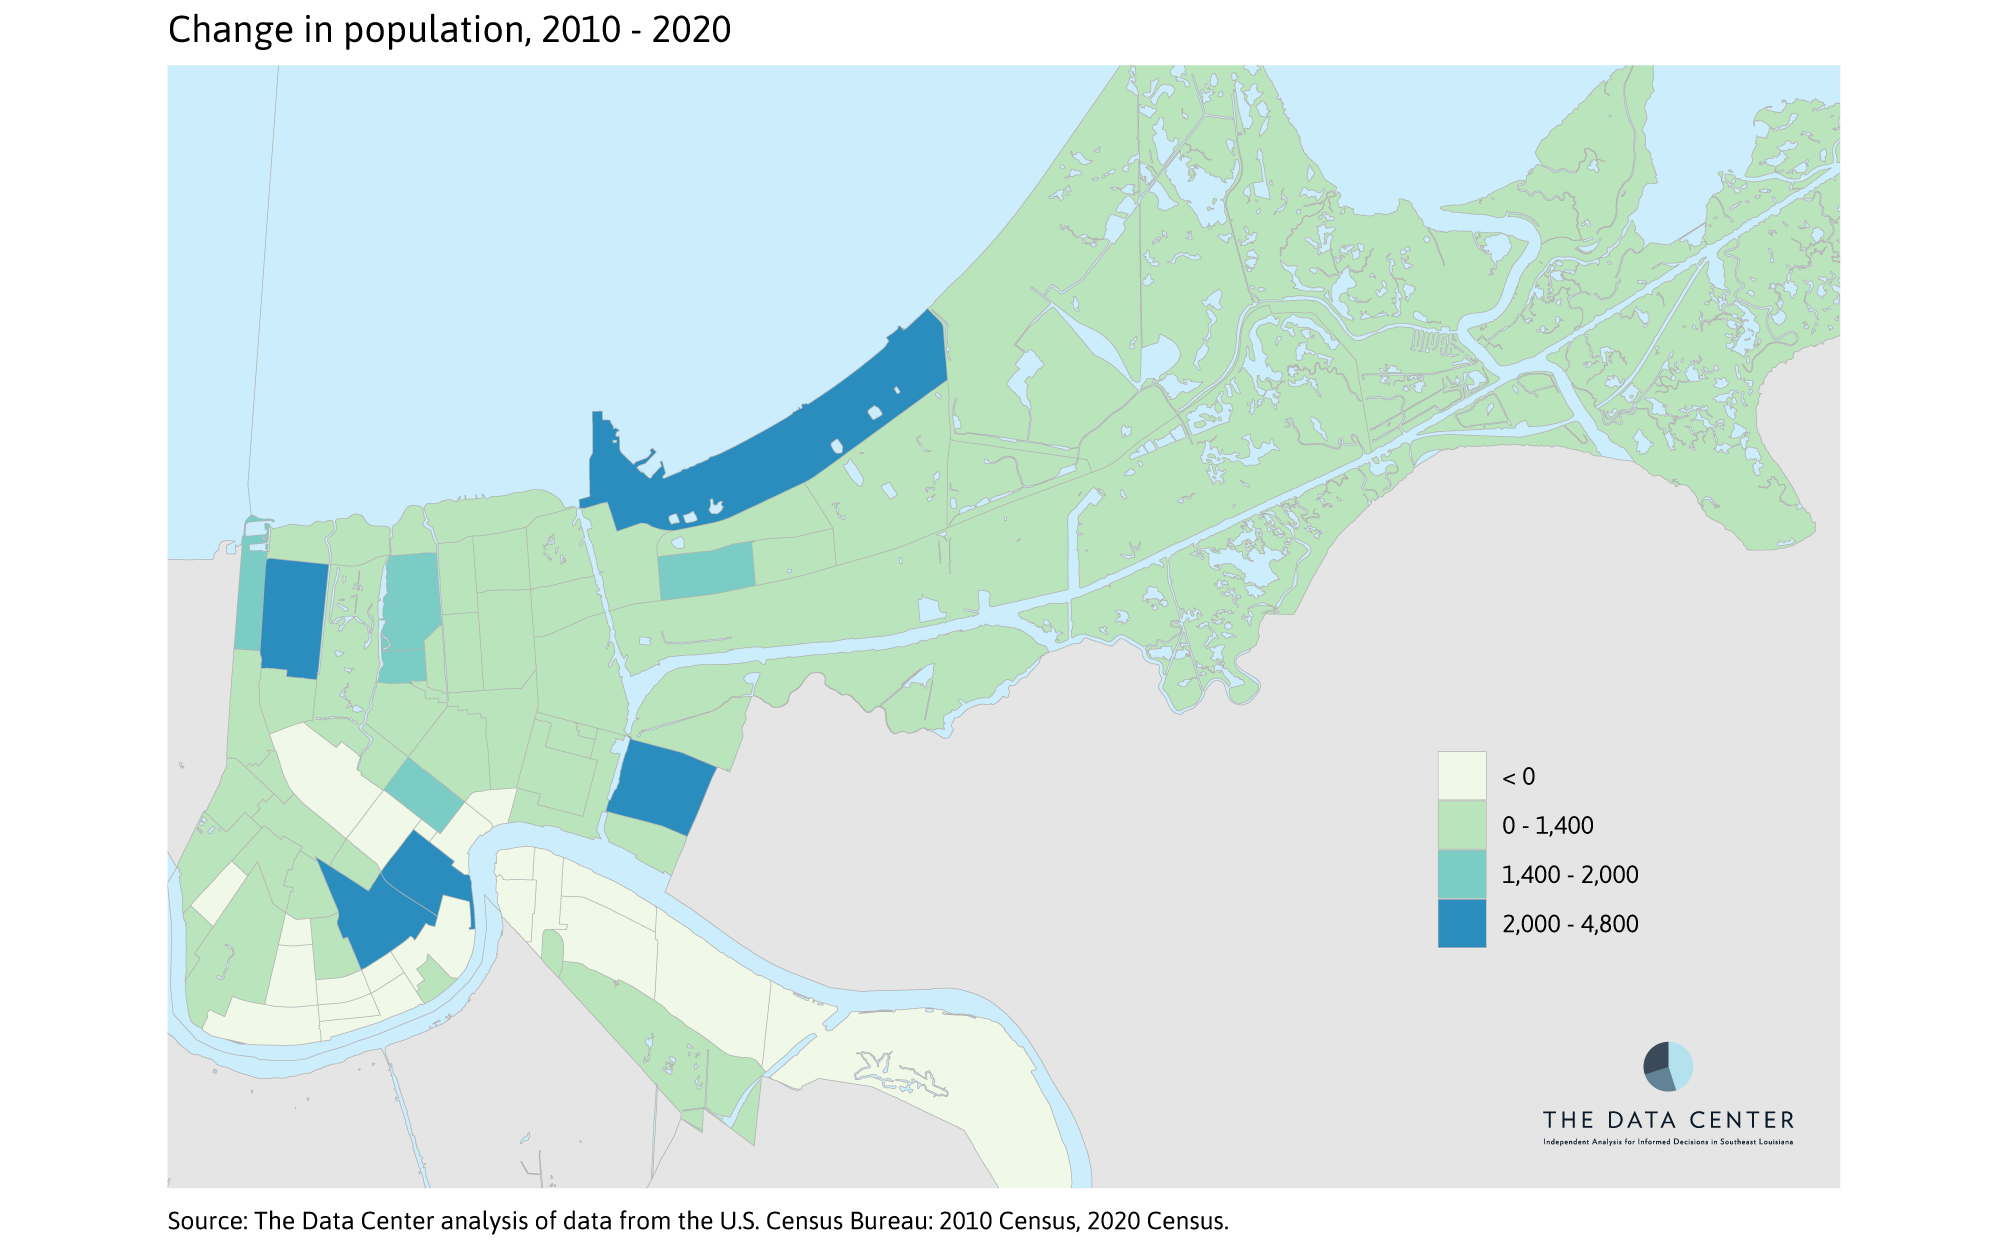
Seven neighborhoods lost between 250 and 1,300 residents from 2010 to 2020. Among these are:
- Marigny and Irish Channel which lost population and housing units, likely as historic shotgun doubles were converted to singles and other renovations took place.
- Three neighborhoods on the West Bank: Old Aurora, New Aurora/English Turn, and Whitney which lost both population and housing units.
- French Quarter, driven by declining occupancy rates despite an increase in housing units—suggesting that increasingly homes in the French Quarter are used seasonally.
- Mid-City, driven by a substantial decrease in average household size despite an increase in total housing units and occupied households.
Although the city gained total housing units since 2010, gains were uneven with nearly half of all neighborhoods losing housing units. Among the 21 neighborhoods that lost population, 17 of those also lost housing units.
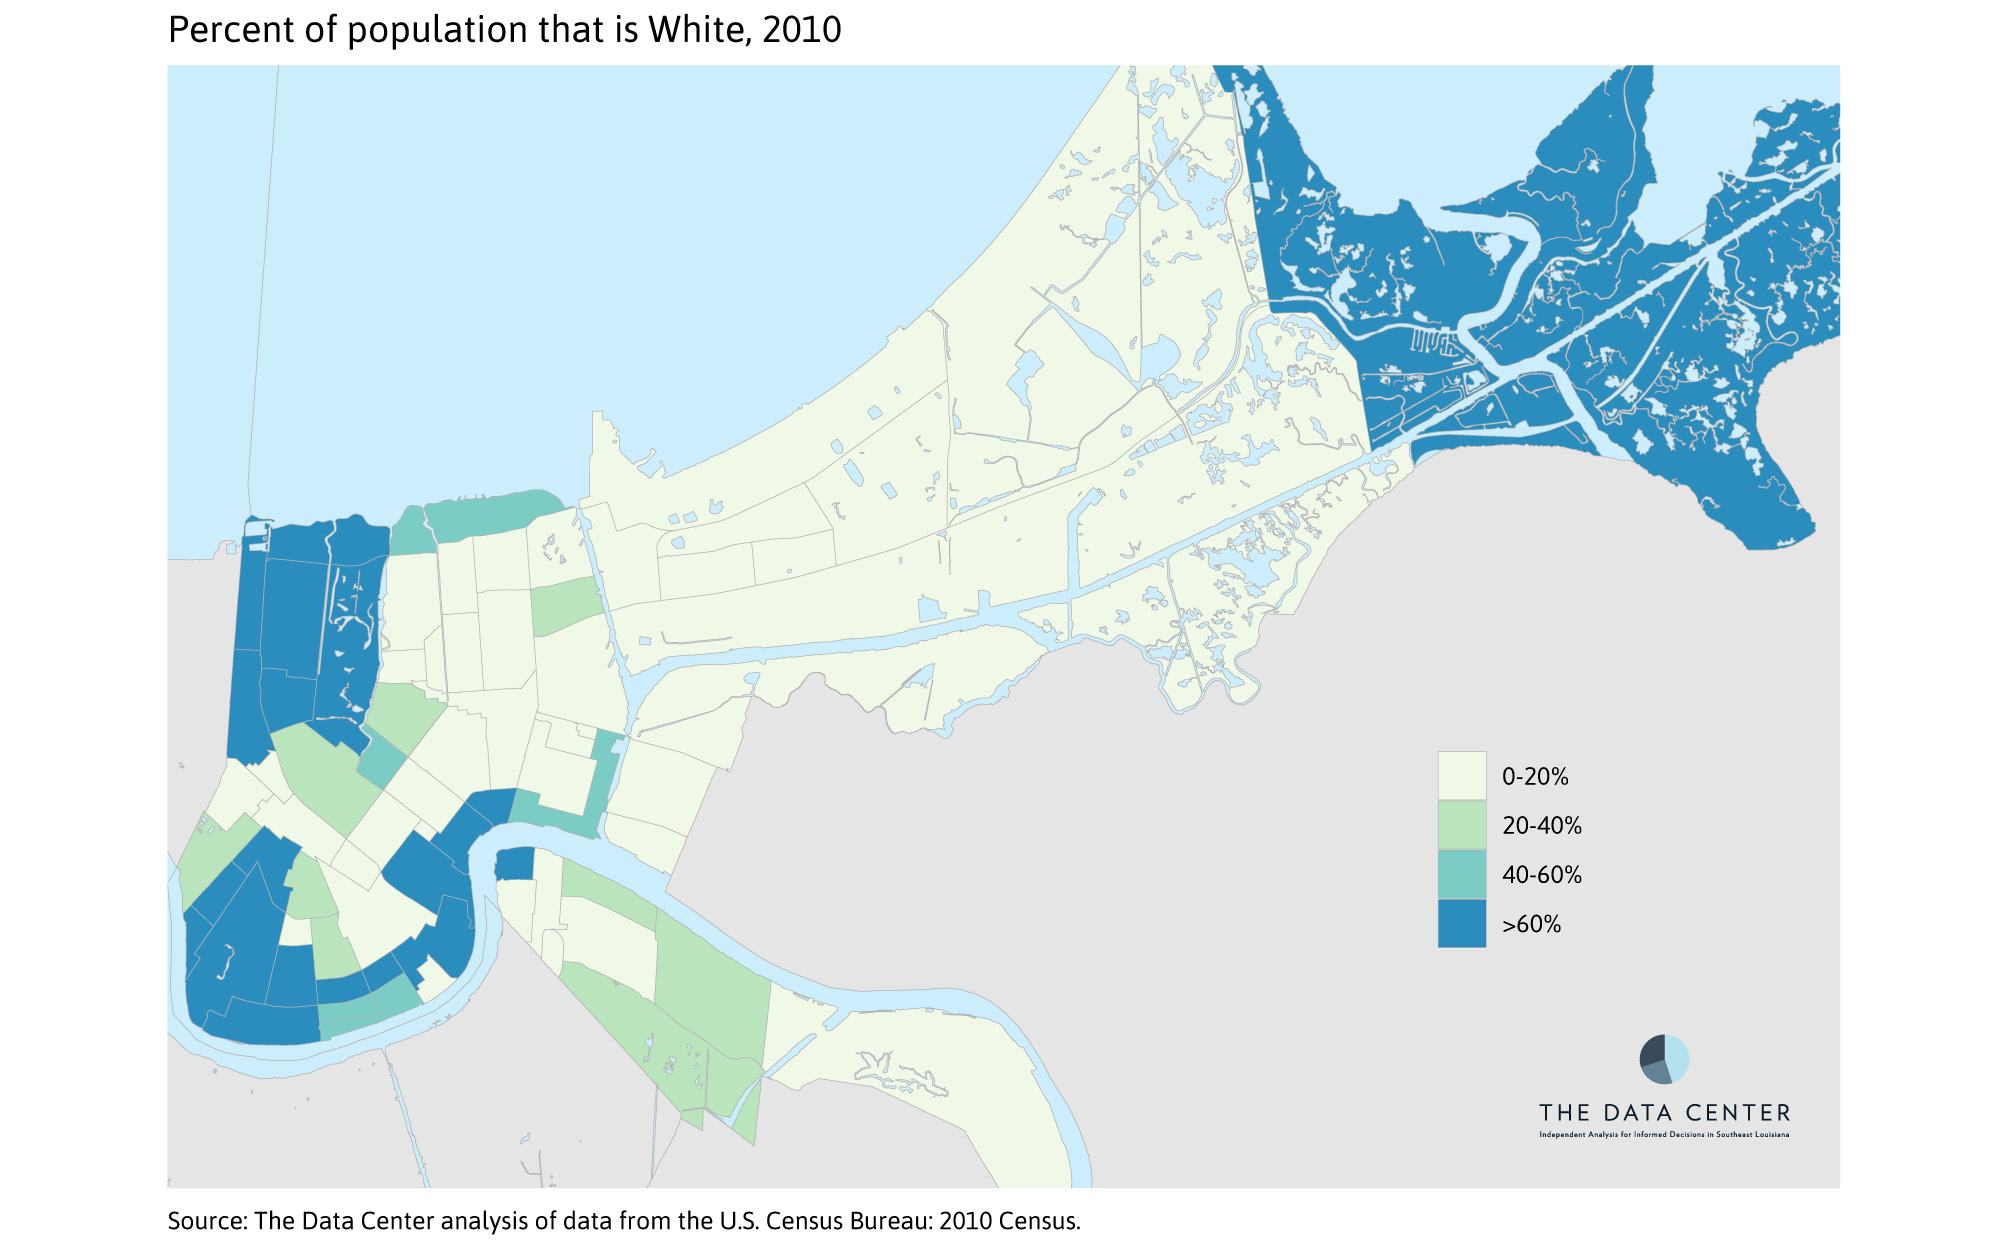
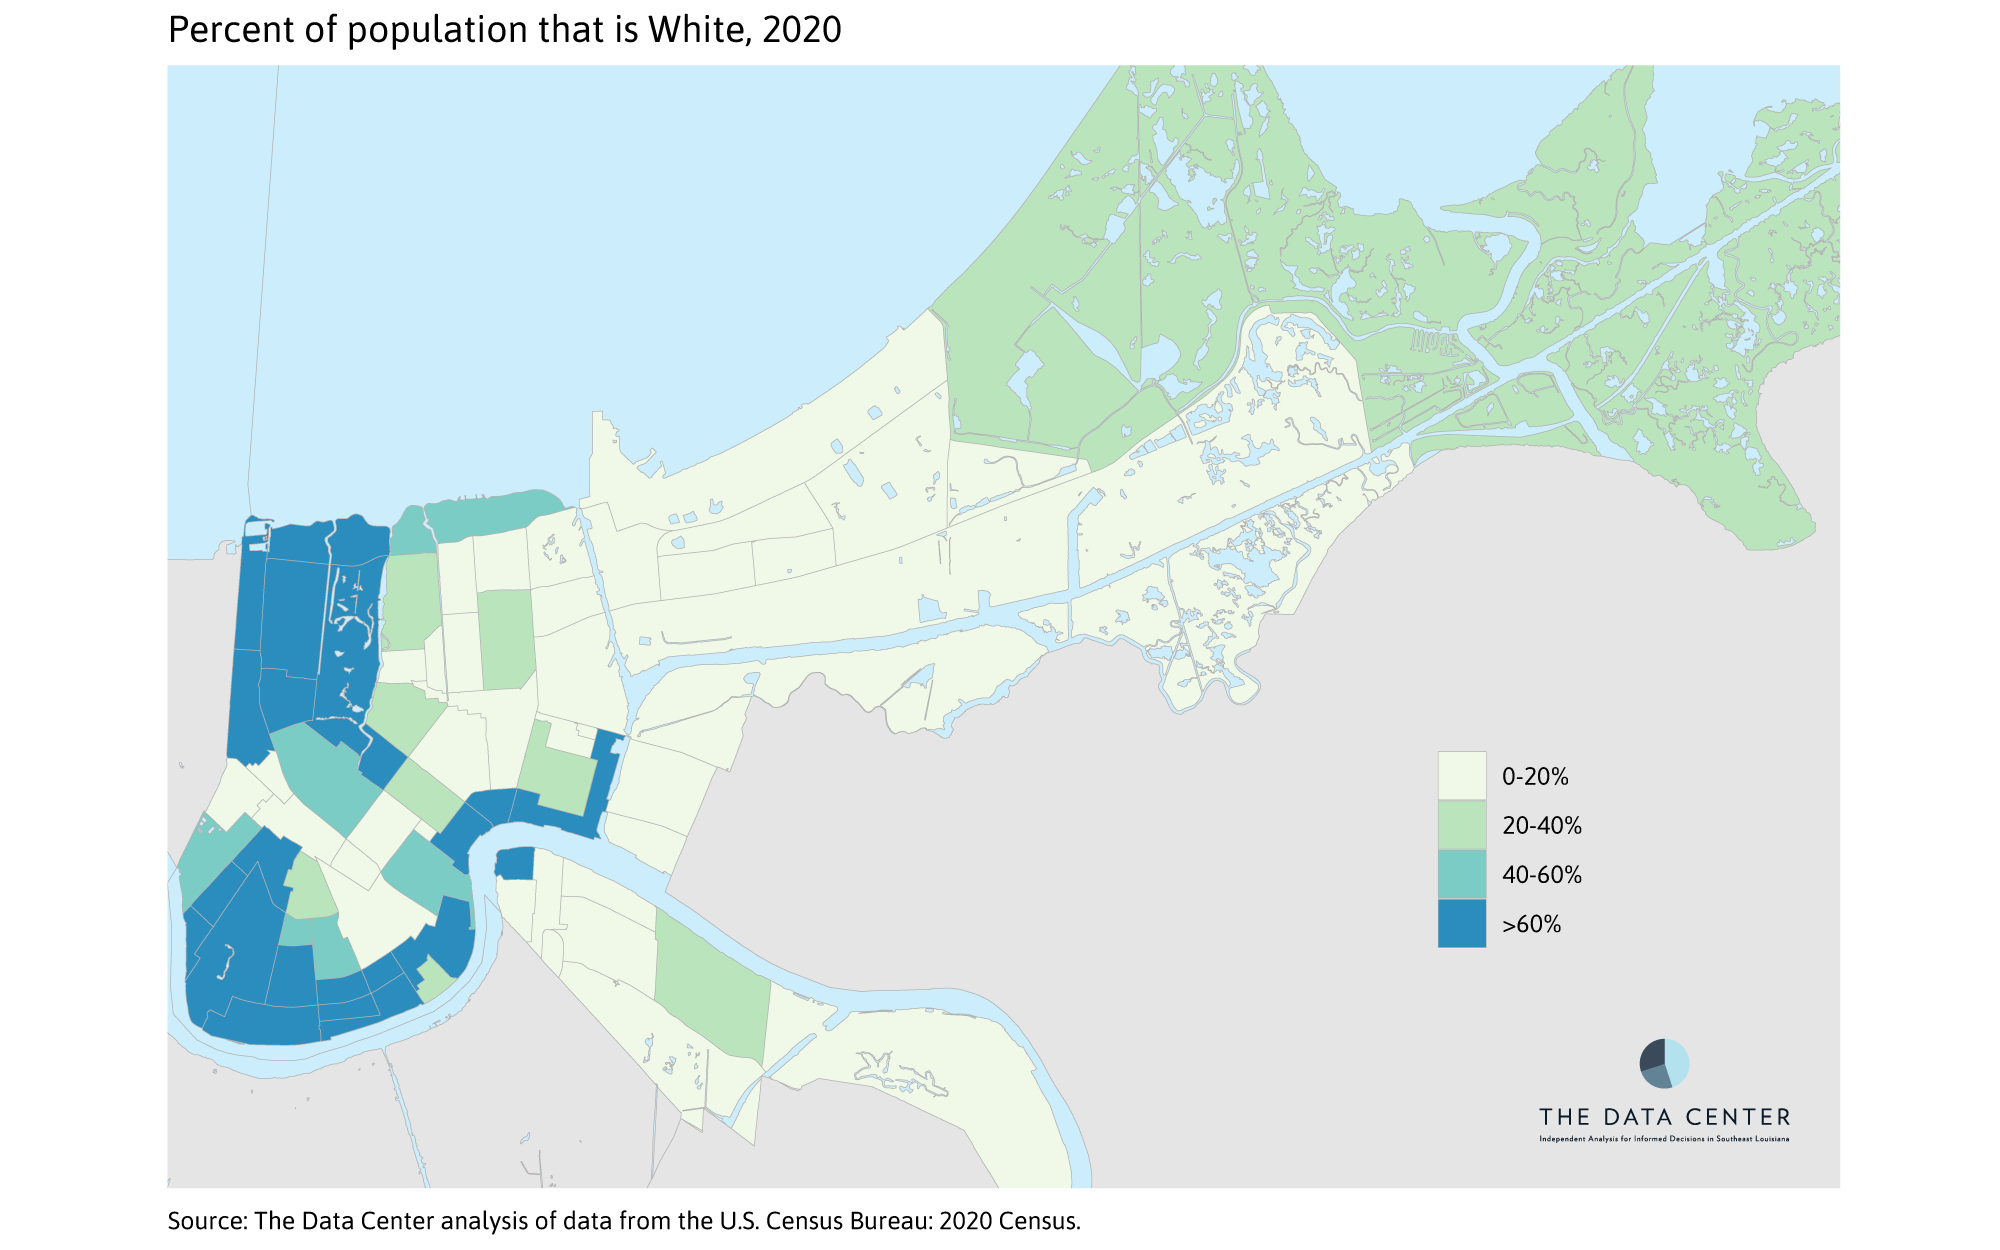
Over the last decade, the share of New Orleans’ population that is Hispanic grew by three percentage points, White grew by two percentage points, and Multiracial grew by nearly two percentage points.
From 2010 to 2020, Orleans Parish gained 40,000 residents, over 16,000 of whom are White, nearly 13,000 Hispanic, almost 8,000 Multiracial, 1,000 Black and about 700 Asian. Thus by 2020, the city’s residents were increasingly Hispanic, Multiracial, and White.
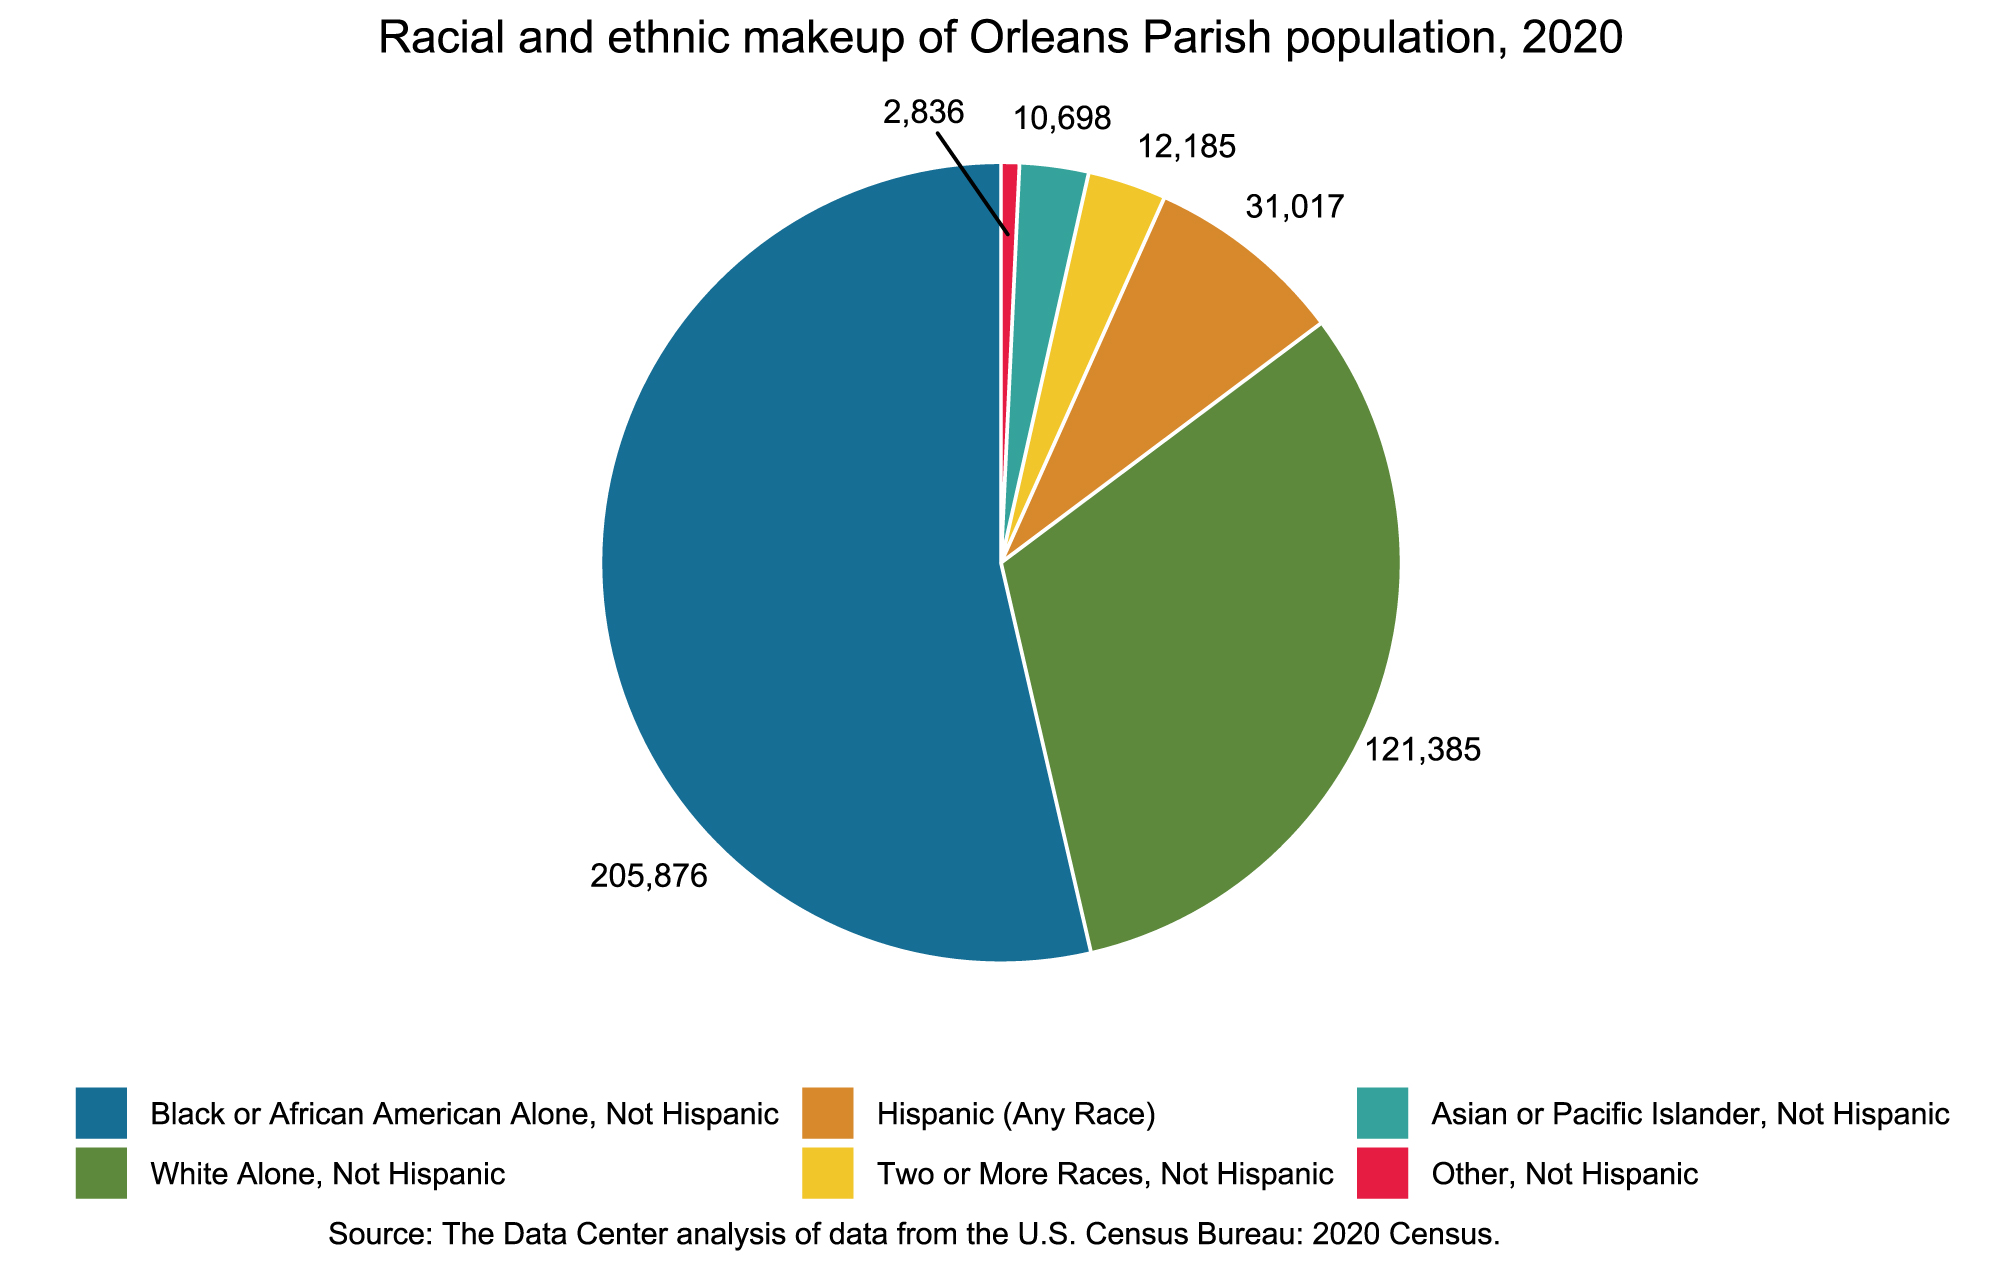
Importantly, Multiracial individuals may be any combination of White, Asian, Black, Native American, Pacific Islander or other races. And the Hispanic residents of New Orleans include White Hispanic, Black Hispanic, Native American-Hispanic, and Multiracial Hispanic individuals (as explored further in our forthcoming brief on population shifts across metro New Orleans) and should not be treated as a monolith. But for the purposes of this neighborhood analysis, we combine New Orleanians into five broad, albeit limited, categories.
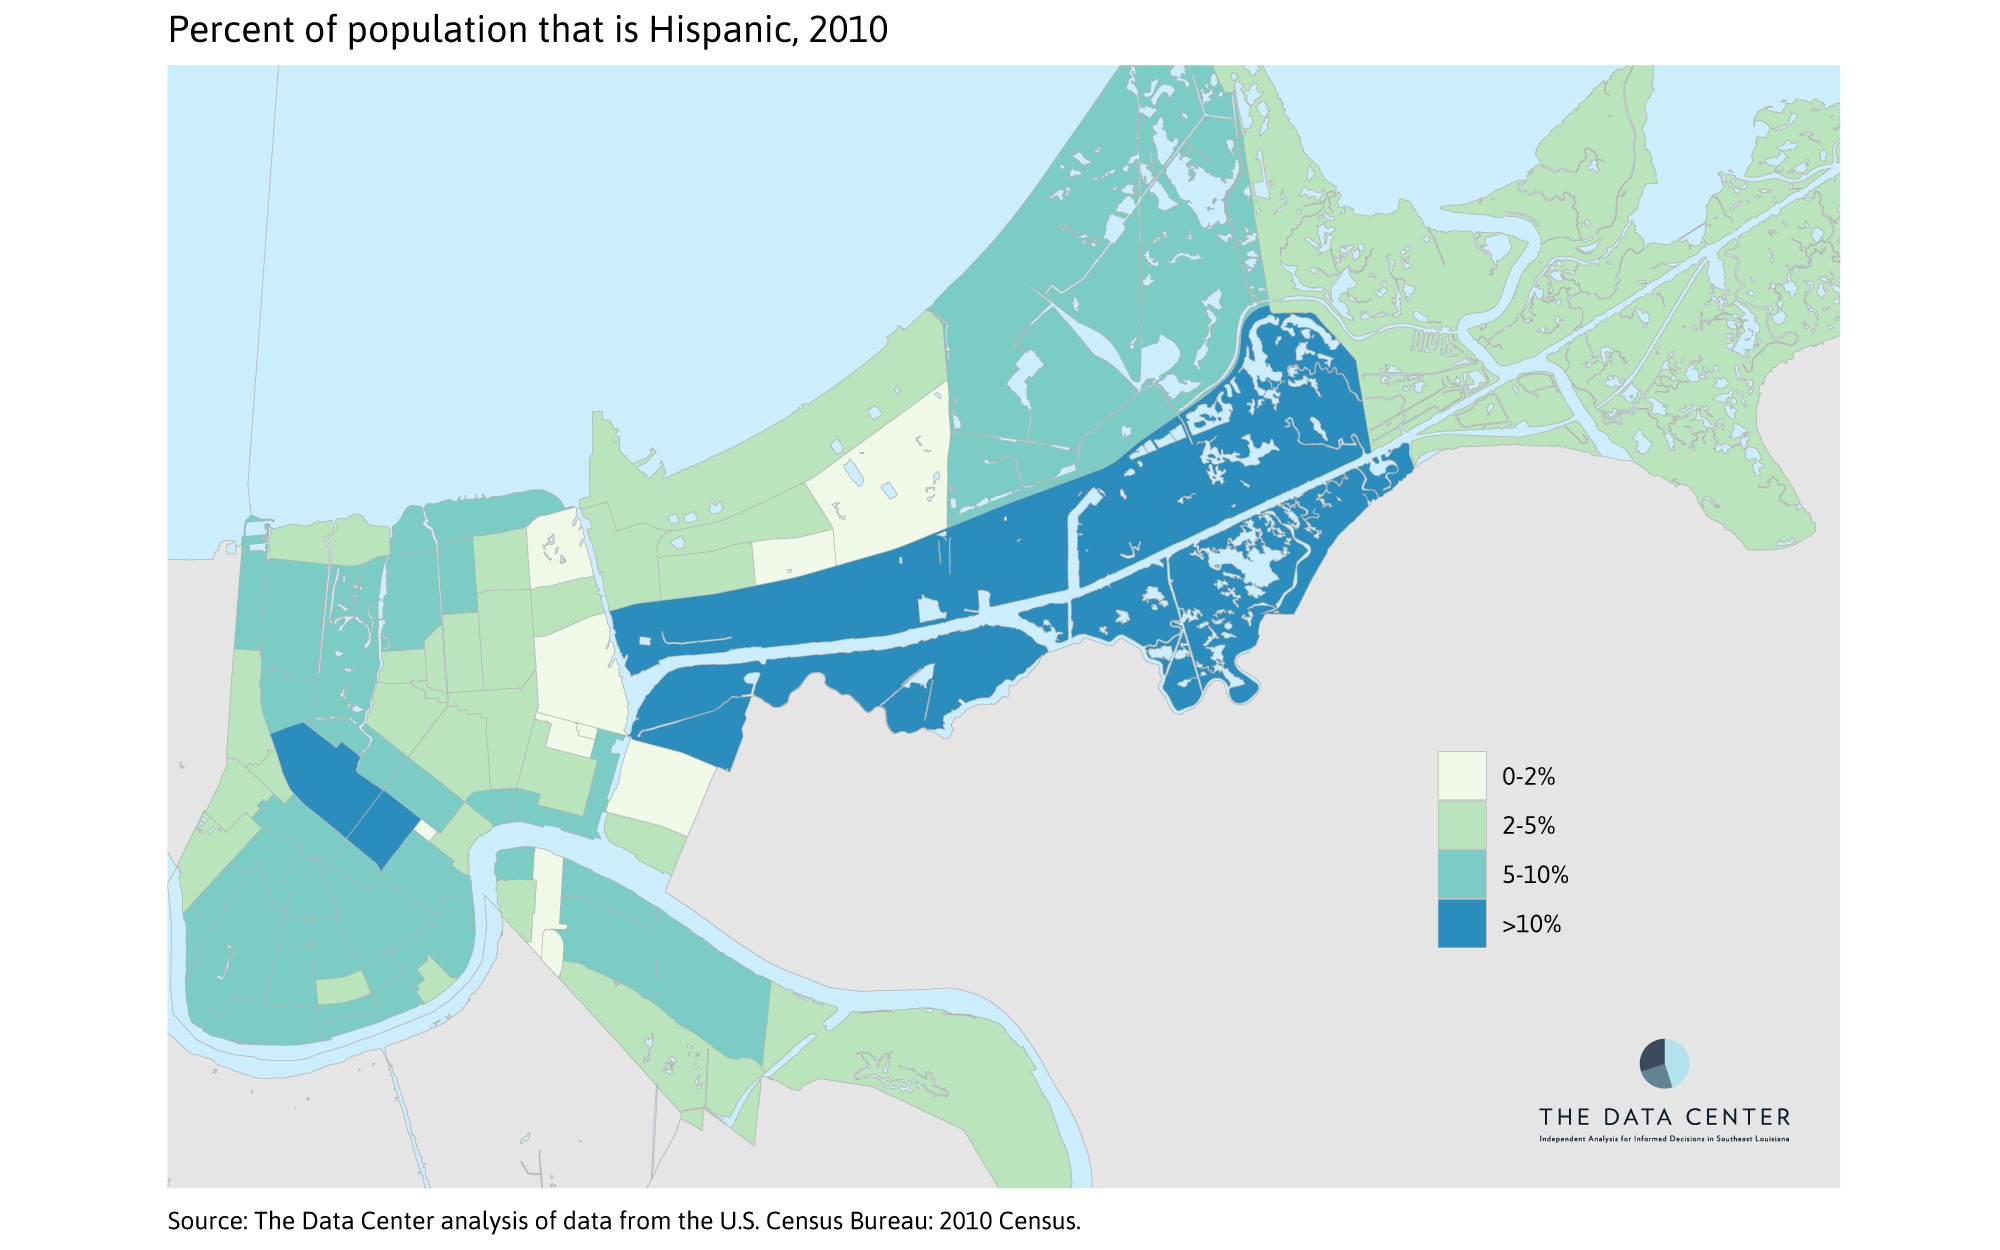
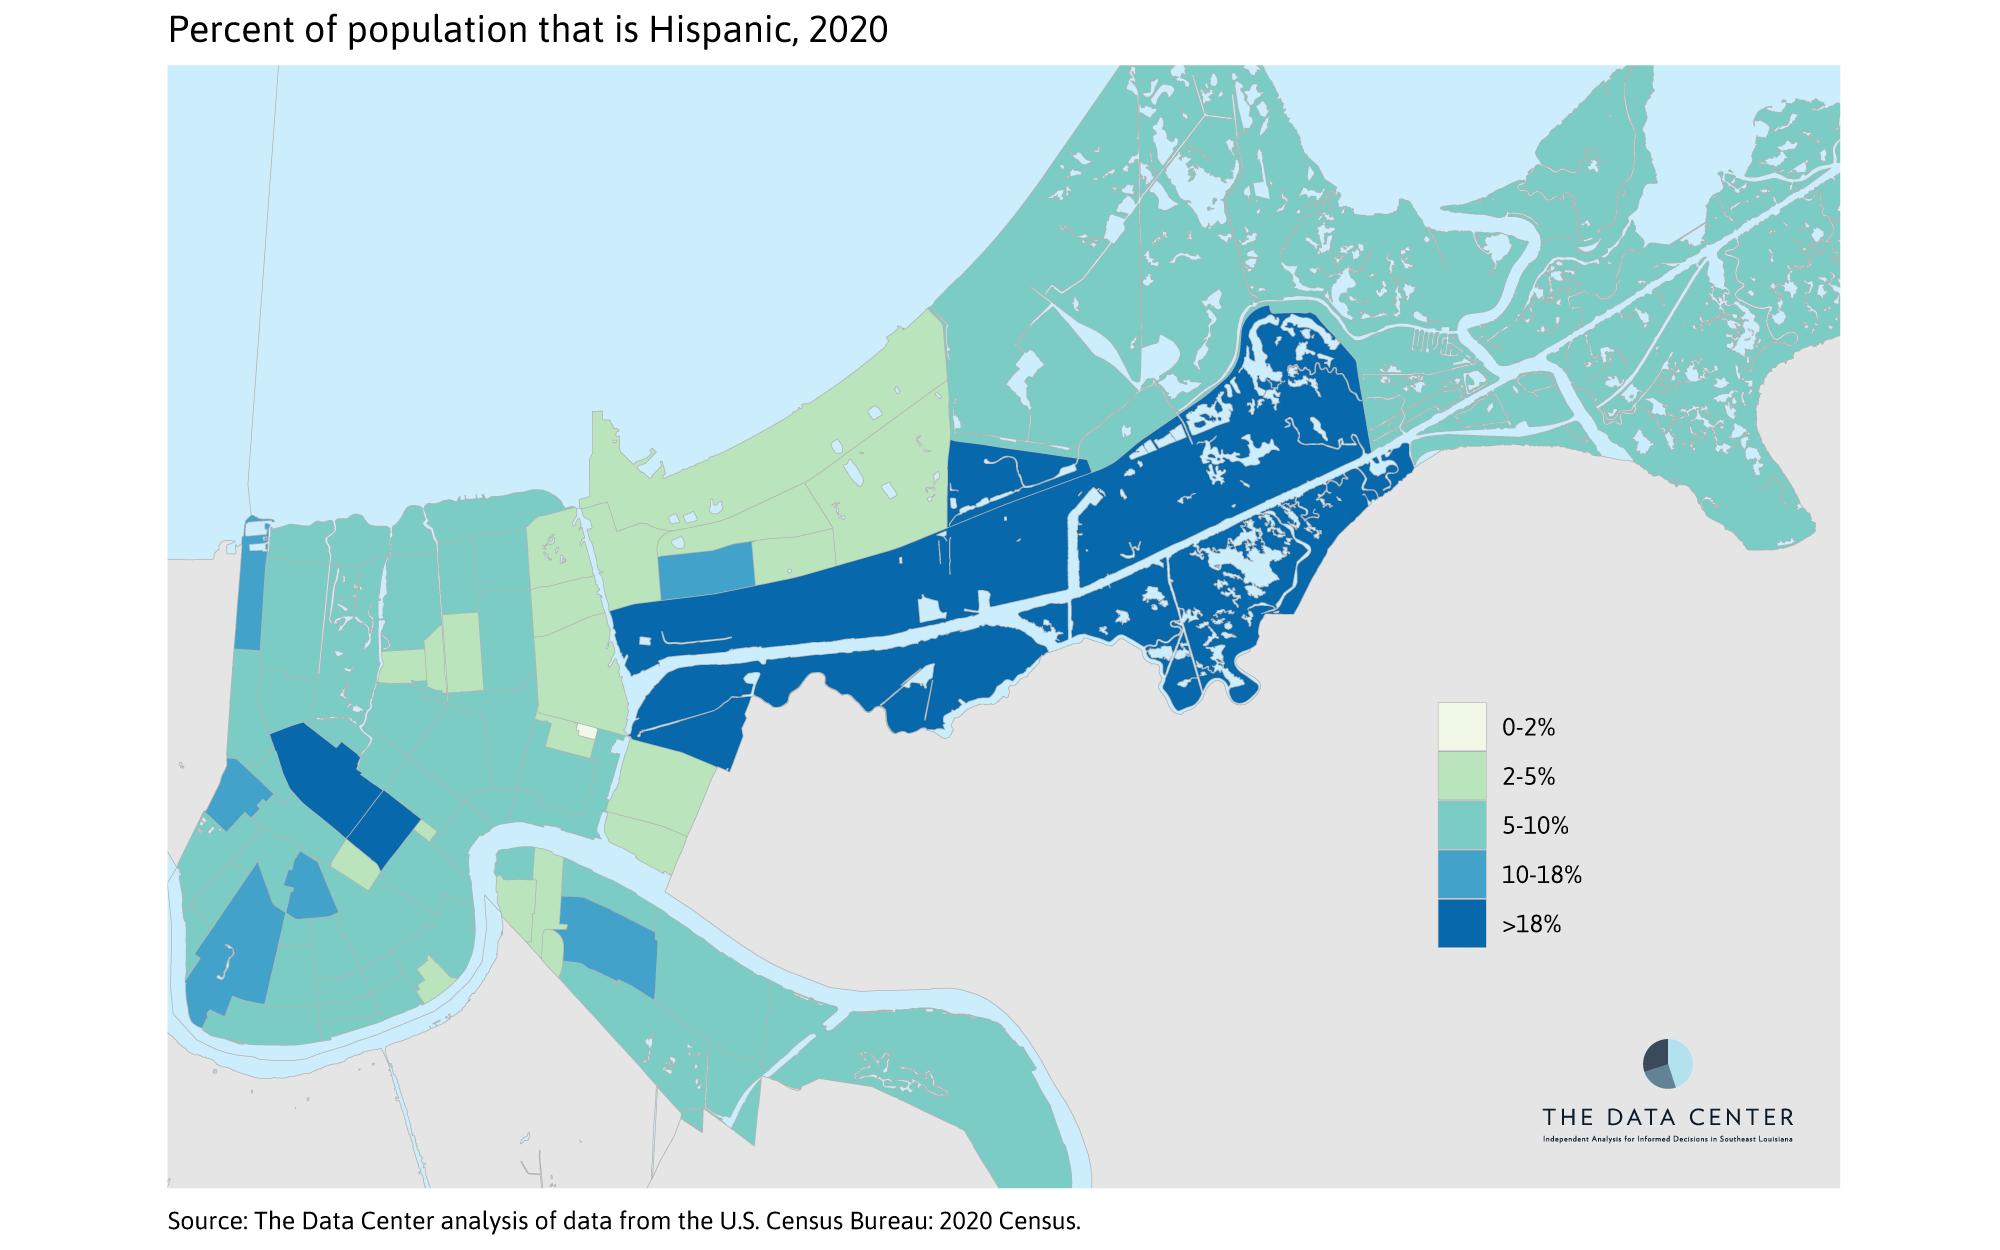
The fast-growing Hispanic population in New Orleans now represents 8 percent of total population. In 2020, Hispanic New Orleanians are particularly concentrated in neighborhoods where they have historically had large populations such as Mid-City, Tulane/Gravier, and Viavant/Venetian Isles. In each of these three neighborhoods, Hispanic individuals represented more than 10 percent of residents in 2010 and by 2020 represented over 18 percent of residents. But Hispanic New Orleanians are growing in number and now represent more than 10 percent of residents in Audubon, Behrman, Broadmoor, Hollygrove, Plum Orchard, Village de l’Est, and West End.
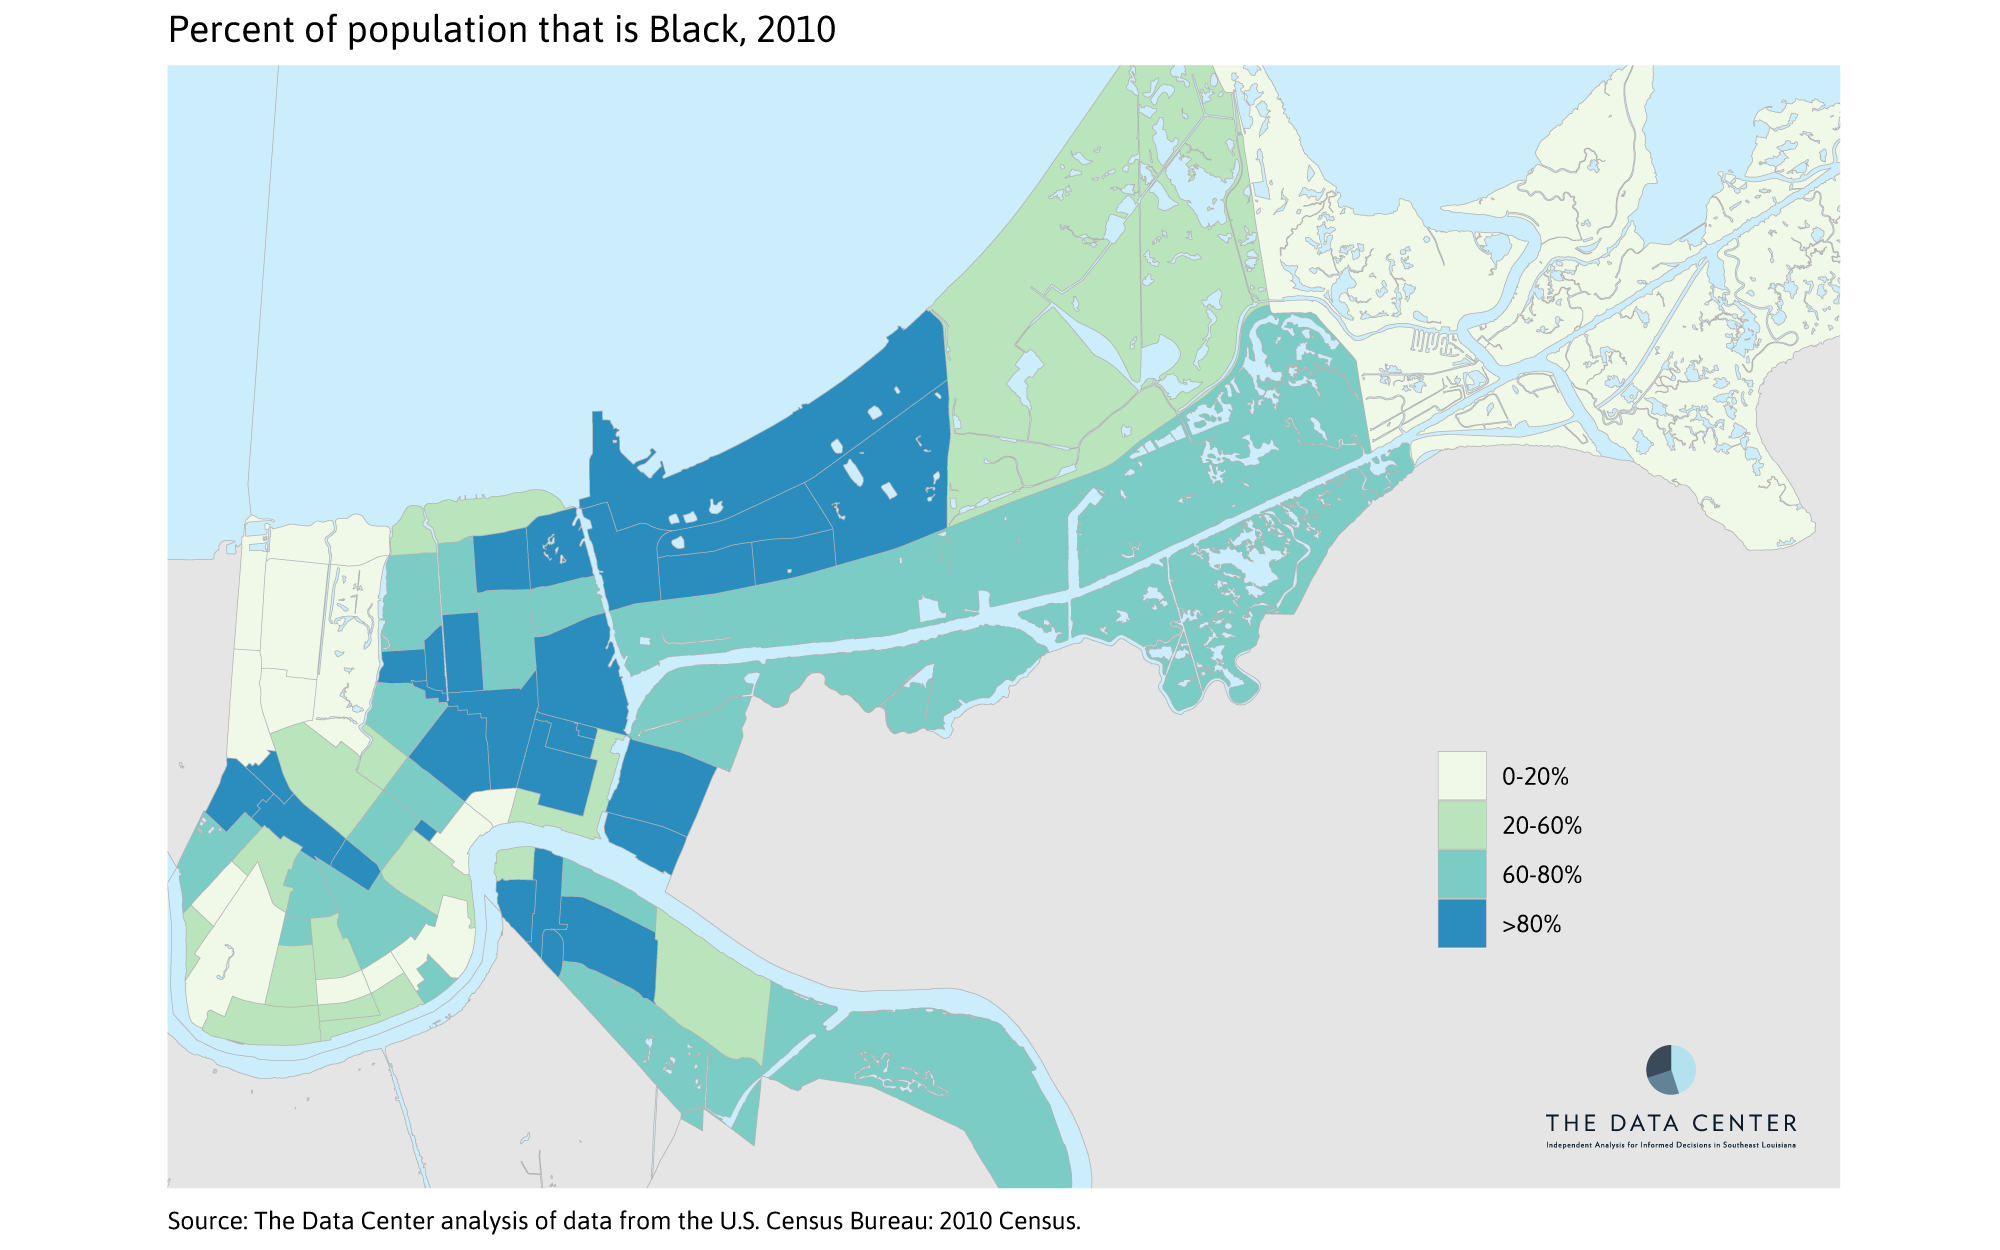
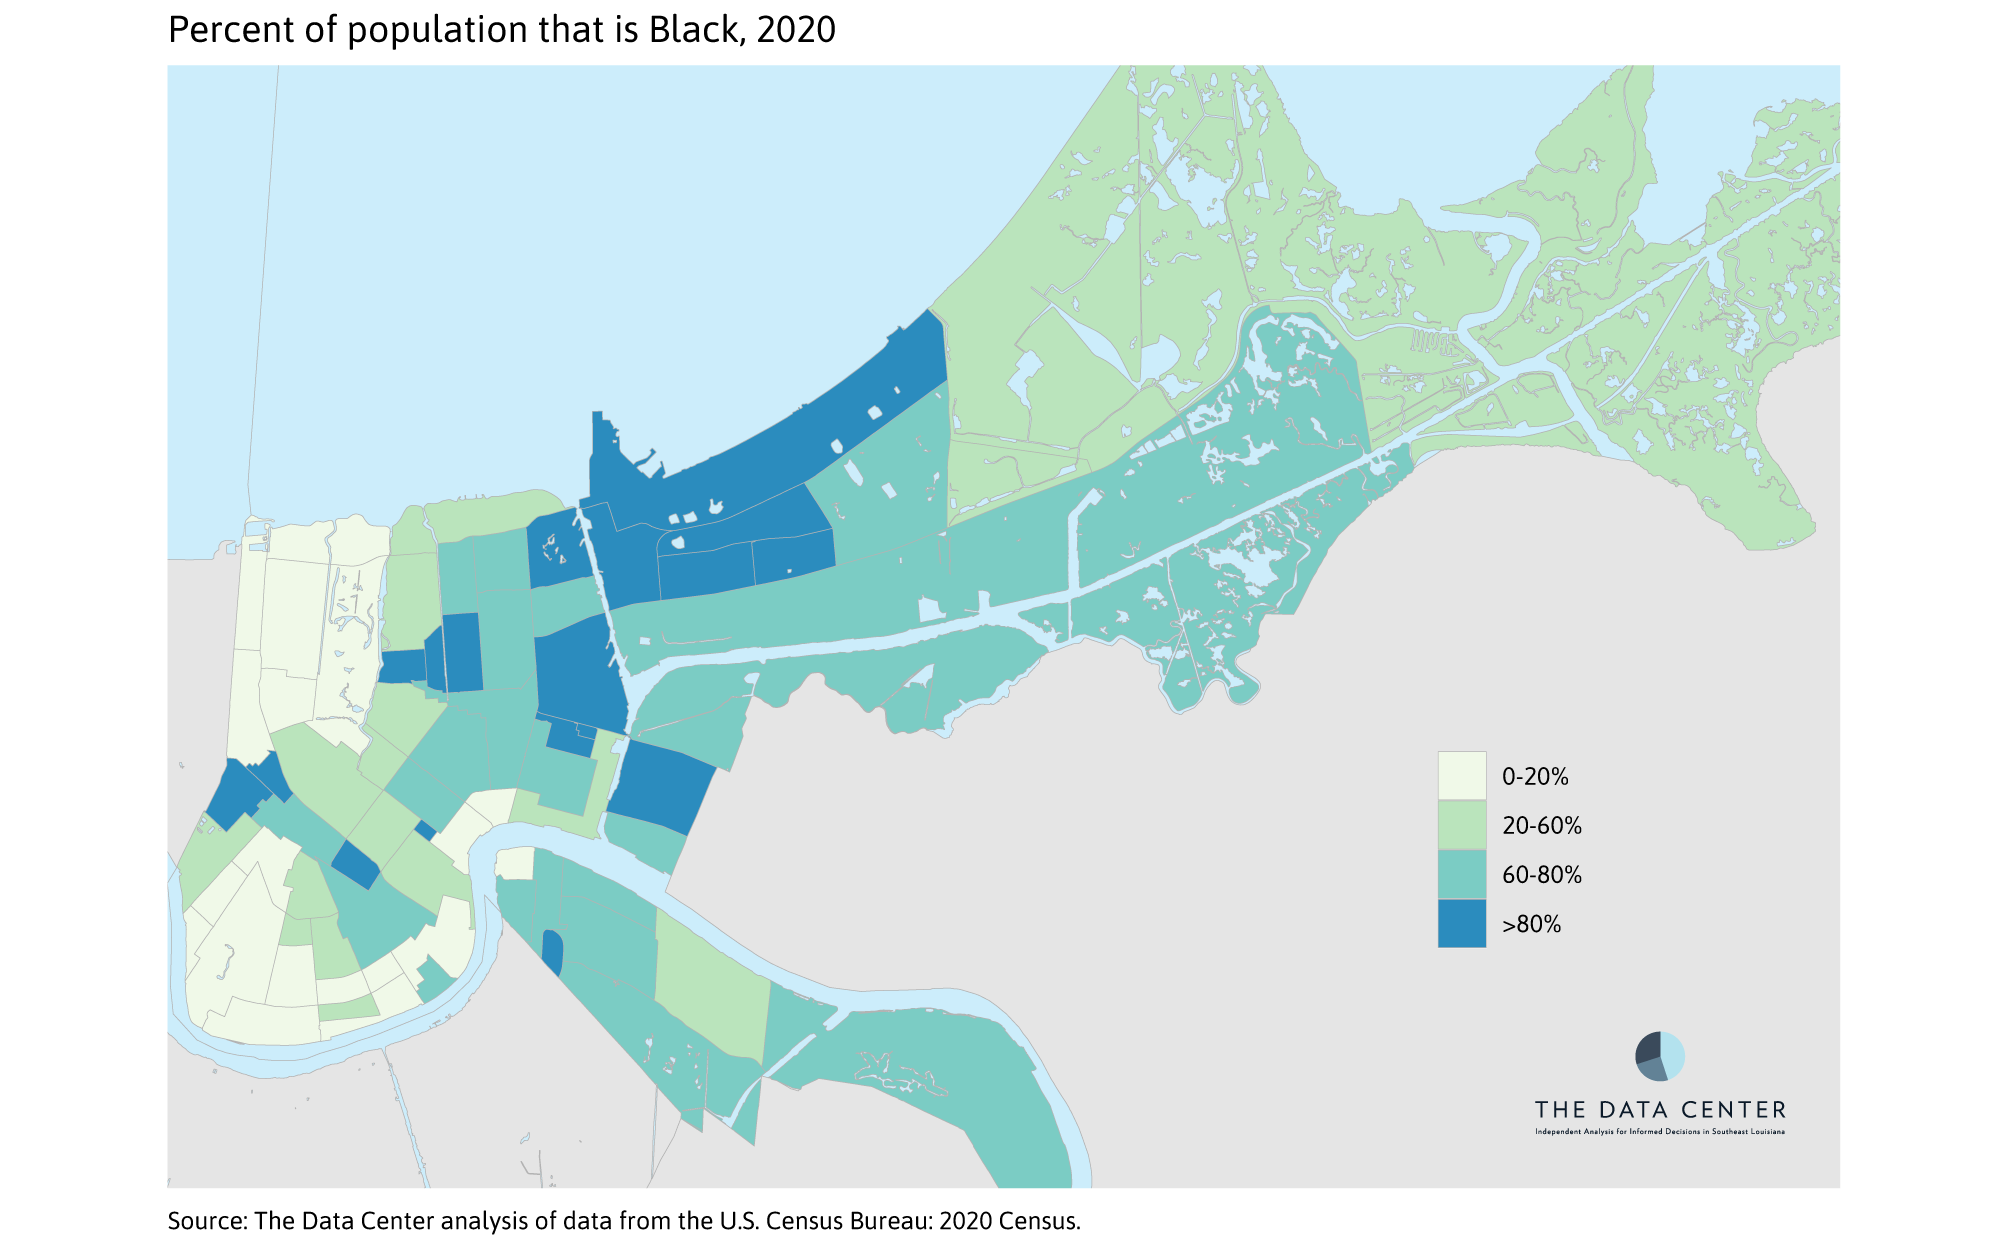
The growth in the Black population of New Orleans was eclipsed by other groups, as such, the share of New Orleans that is African American fell to 54 percent. In 17 neighborhoods, the population is still over 80 percent Black including B.W. Cooper Apts., Desire, Dillard, Dixon, Fischer Development, Florida Area, Florida Development, Hollygrove, Iberville, Little Woods, Lower Ninth Ward, Pines Village, Plum Orchard, Pontchartrain Park, Read Blvd West, St. Bernard Area, and West Lake Forest.
In several other neighborhoods, the share of the Black population has shrunk but remains above 60 percent. These include:
- Behrman and U.S. Naval Support Area where the Black population declined while the Hispanic population grew substantially.
- Gentilly Terrace, McDonogh, Seventh Ward, St. Claude, St. Roch, St. Thomas Development, and Whitney where the Black population declined while the White and Hispanic populations grew substantially.
- Viavant/Venetian Isles where the Black population grew but the Hispanic population grew faster, such that the Black share of the population shrank.
- Read Blvd East where the Black population grew but the Asian population grew faster such that the Black share of the population shrank.
- Central City, Gert Town, Holy Cross, Milneburg, St. Anthony, and Tremé/Lafitte where the Black population grew but the White and Hispanic populations grew faster, such that the Black share shrank over the decade.
In Fairgrounds, Freret, and Leonidas, the share of the Black population fell to below 60 percent, and in Broadmoor, Mid-City, and Milan it fell to below 50 percent, as the White and Hispanic populations grew substantially in all these neighborhoods.
In Filmore, the Black population grew, but White and Hispanic populations grew faster such that the share of the Black population fell to 52 percent.
In Gentilly Woods, Lake Terrace & Lake Oaks, Old Aurora, and Tall Timbers/Brechtel, the share of Black population grew. This was true in Lake Catherine/Village de l’Est but likely because of the census tract boundary change described earlier.
The White population of New Orleans grew by over 16,000 such that they now represent 32 percent of the city. The White population remains above 60 percent of residents in Algiers Point, Audubon, Black Pearl, City Park, East Carrollton, French Quarter, Garden District, Lakeshore/Lake Vista, Lakeview, Lakewood, Lower Garden District, Marigny, Marlyville/Fontainebleau, Navarre, Touro, Uptown, West End, and West Riverside.
In Bayou St. John, Bywater, East Riverside, and Irish Channel, the White population has grown such that it is now above 60 percent of the population. In contrast, in the Central Business District the White population has grown, but not as fast as all other racial groups combined grew, such that the White share fell to below 60 percent. In Lake Catherine/Village de L’Est the share of the White population fell substantially due to the incorporation of the more diverse portion of Village de l’Est.
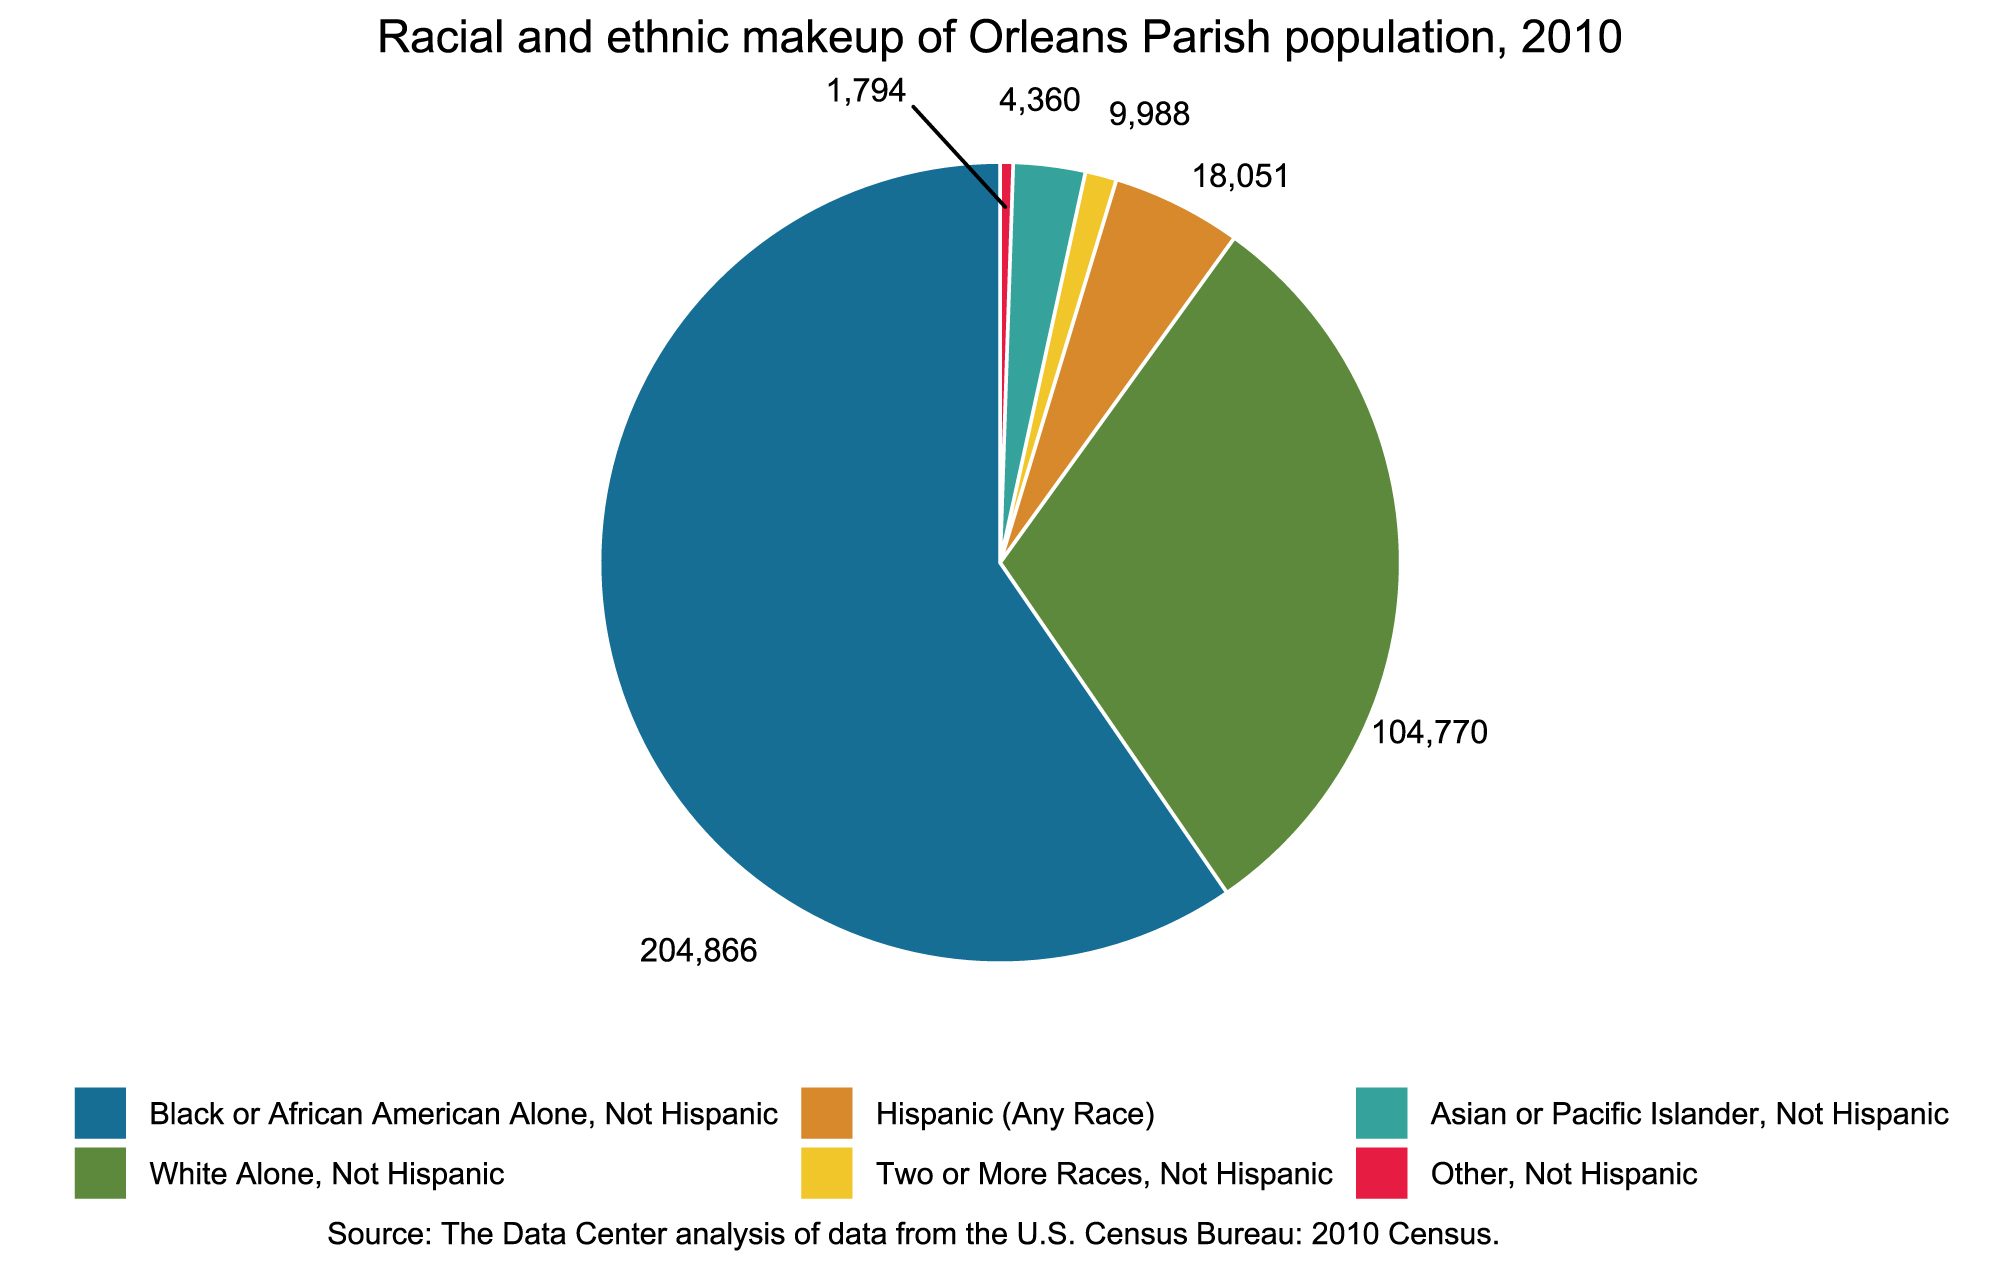
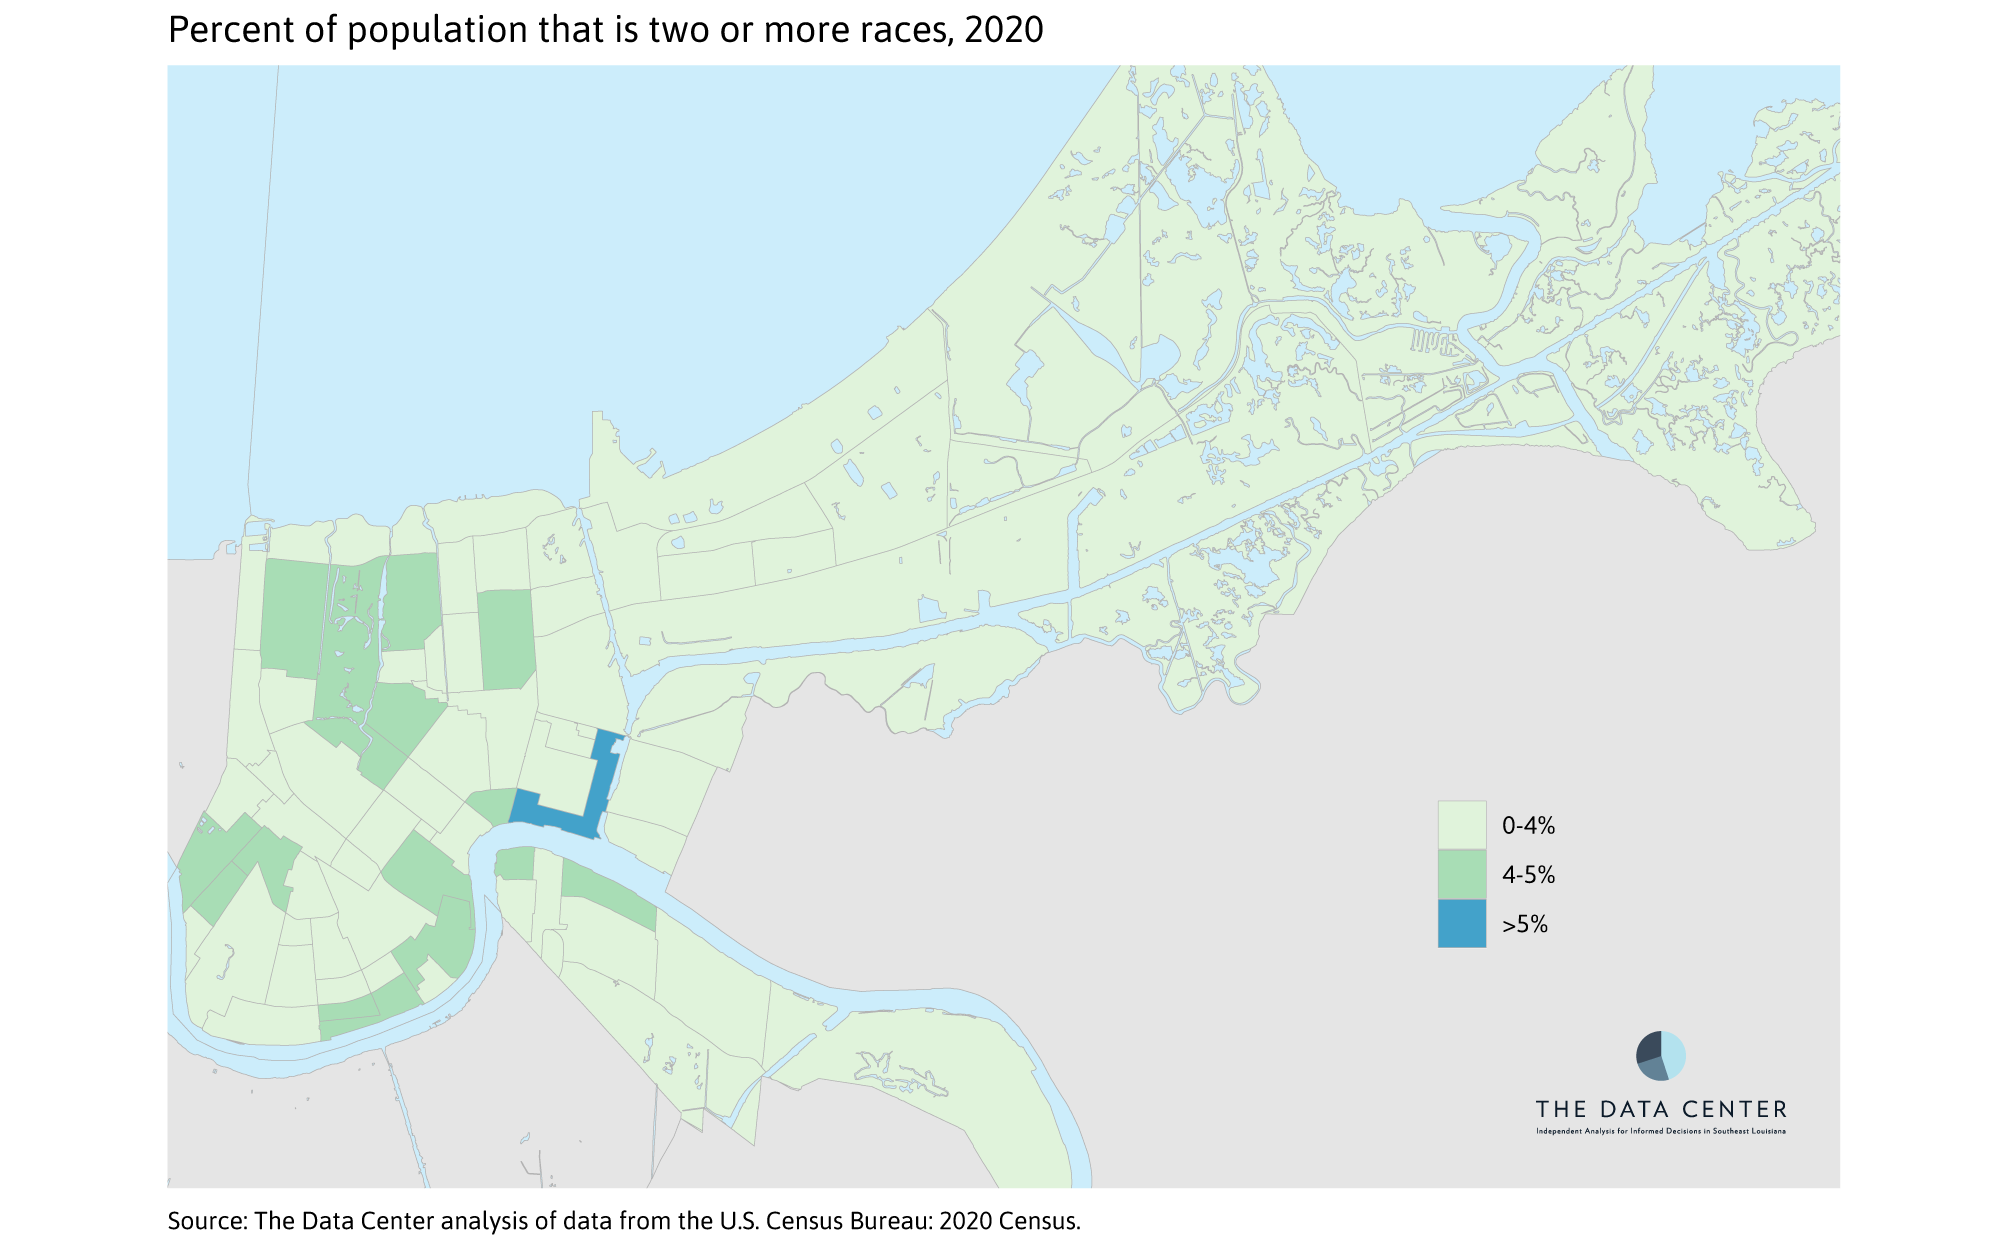
The fastest growing segment of the New Orleans population is people identifying as more than one race. The number of New Orleanians identifying as more than one race more than doubled from 4,360 in 2010 to over 12,000 in 2020, such that that this group now represents 3.2 percent of New Orleanians.
Multiracial New Orleanians live in every neighborhood, but represent more than 5 percent of residents in Bywater, and more than 4% of residents in Algiers Point, Bayou St. John, Central Business District, City Park, East Carrollton, East Riverside, Fairgrounds, Filmore, Gentilly Terrace, Irish Channel, Lakeview, Leonidas, Lower Garden District, Marigny, Marlyville/Fountainebleau, U.S. Naval Support Area, and West Riverside.
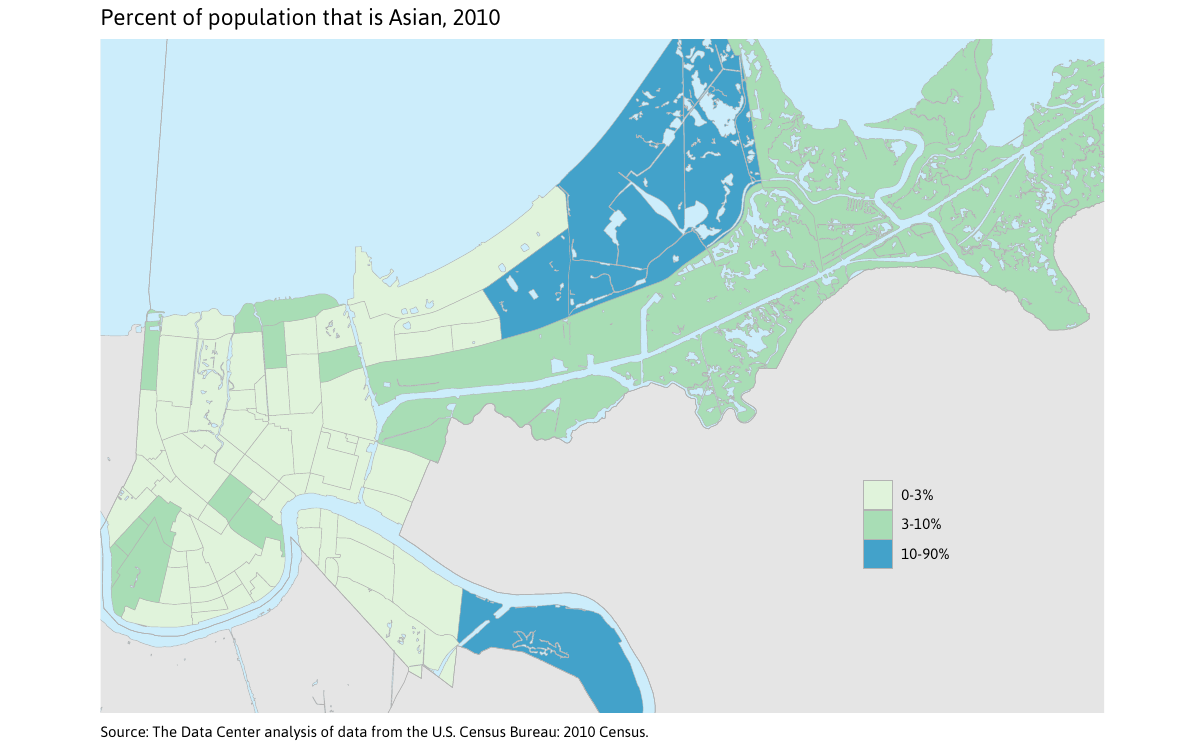
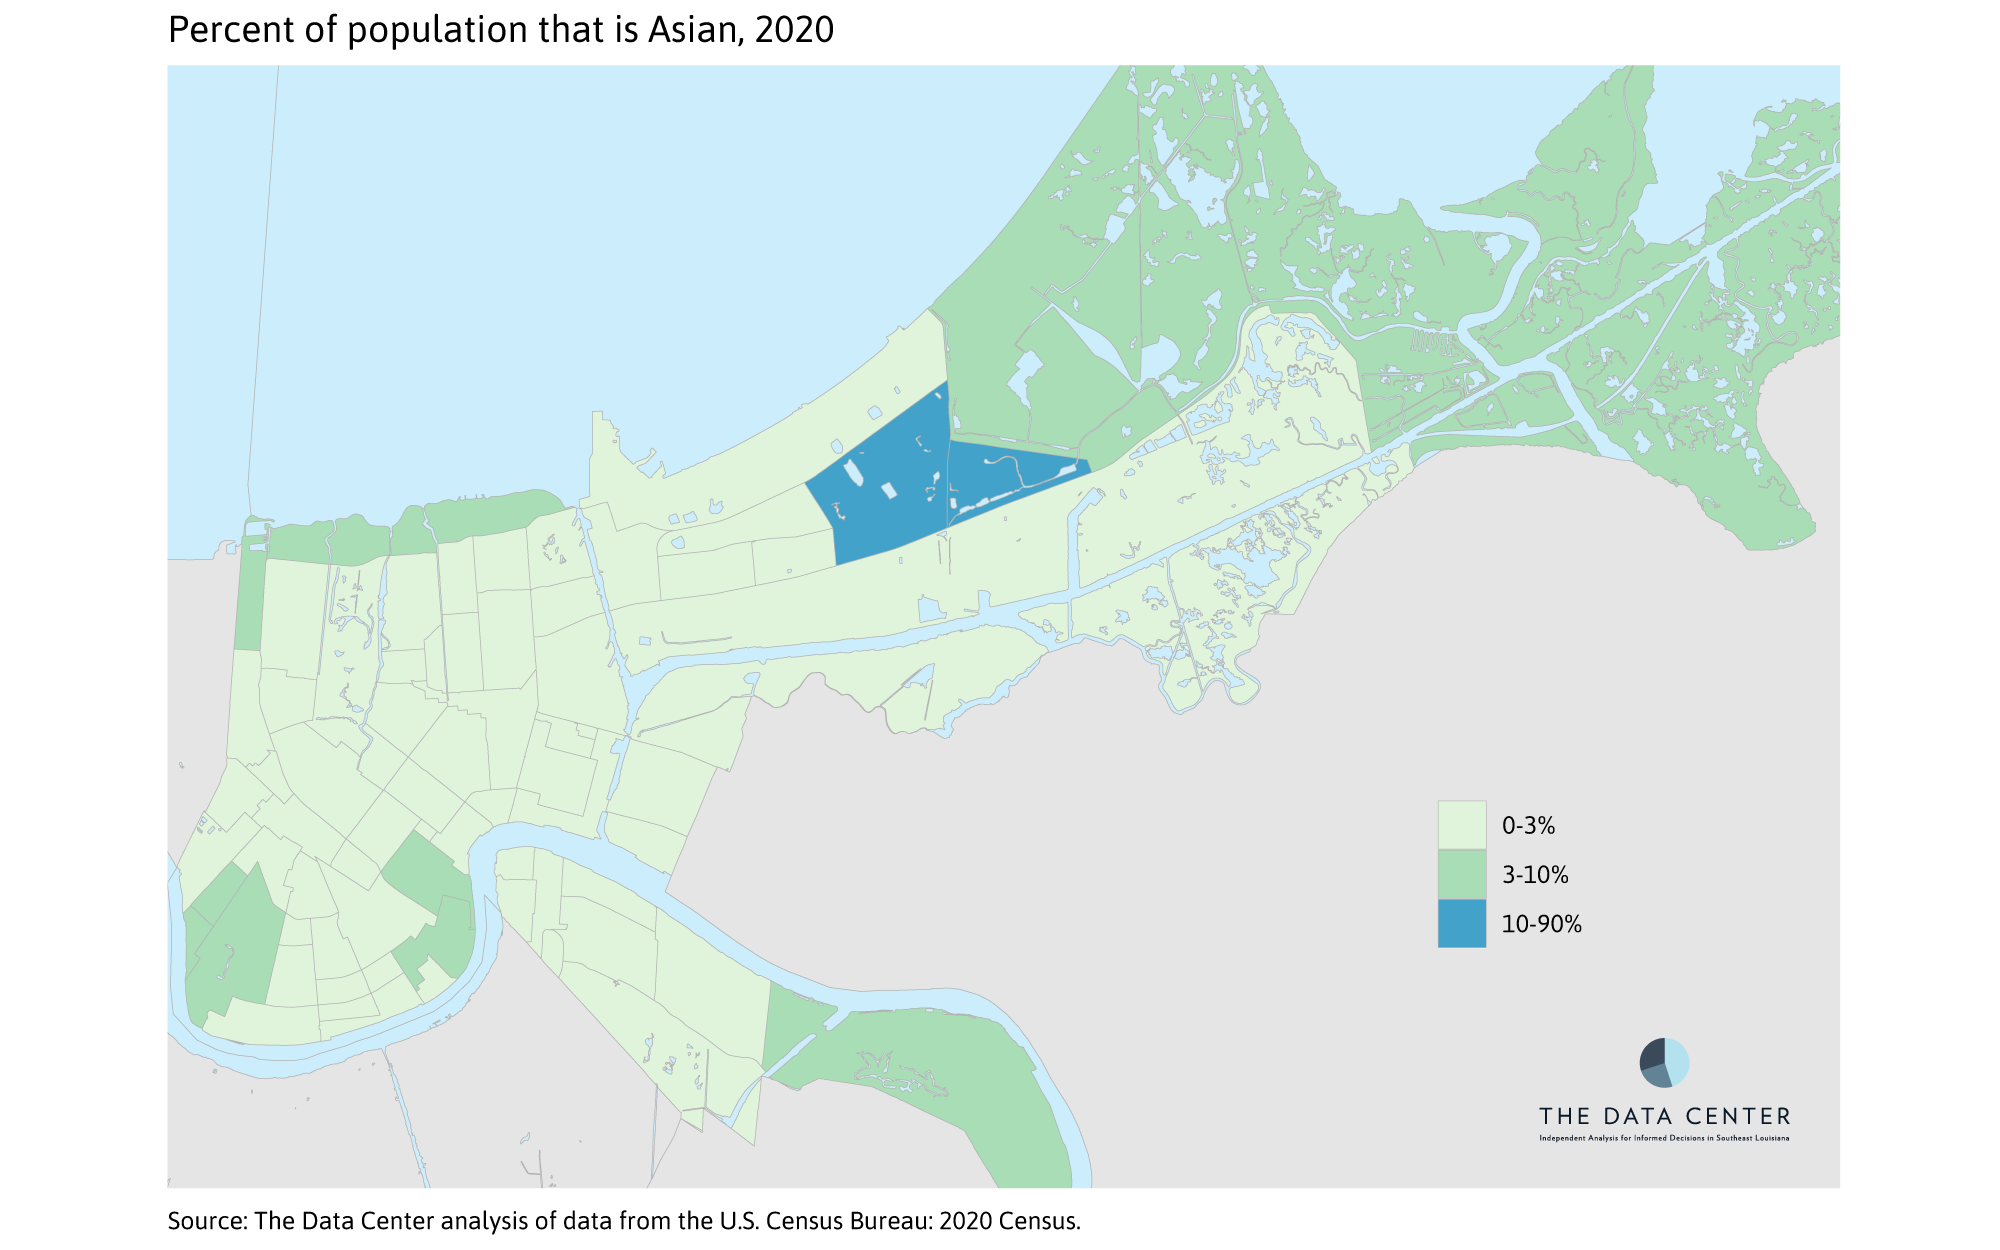
Although the Asian/Pacific Islander population of New Orleans did not grow substantially between 2010 and 2020, and remains about 3 percent of the city’s population, some neighborhoods have particularly large concentrations. Village de l’Est famously has a large share of Asian residents, but the share that is Asian fell from 44.7 percent in 2010 to 32.5 percent in 2020. (As noted above Hispanic residents grew in this neighborhood to 18.6 percent in 2020). Read Blvd East has a large and growing Asian population that was 12.7 percent of residents in 2010 and is now 14.5 percent. In New Aurora/English Turn, the Asian population is large but shrinking—representing 10.6 percent of the population in 2010 down to 8.6 percent in 2020. The Asian population of the Central Business District grew from 7.4 percent in 2010 to 8.7 percent in 2020. The Asian population of Lake Catherine was large in 2010 at 4.9 percent and grew to 6.7 percent by 2020, but this was likely a byproduct of an expanded census tract which means that Lake Catherine now encompasses part of Village de l’Est.
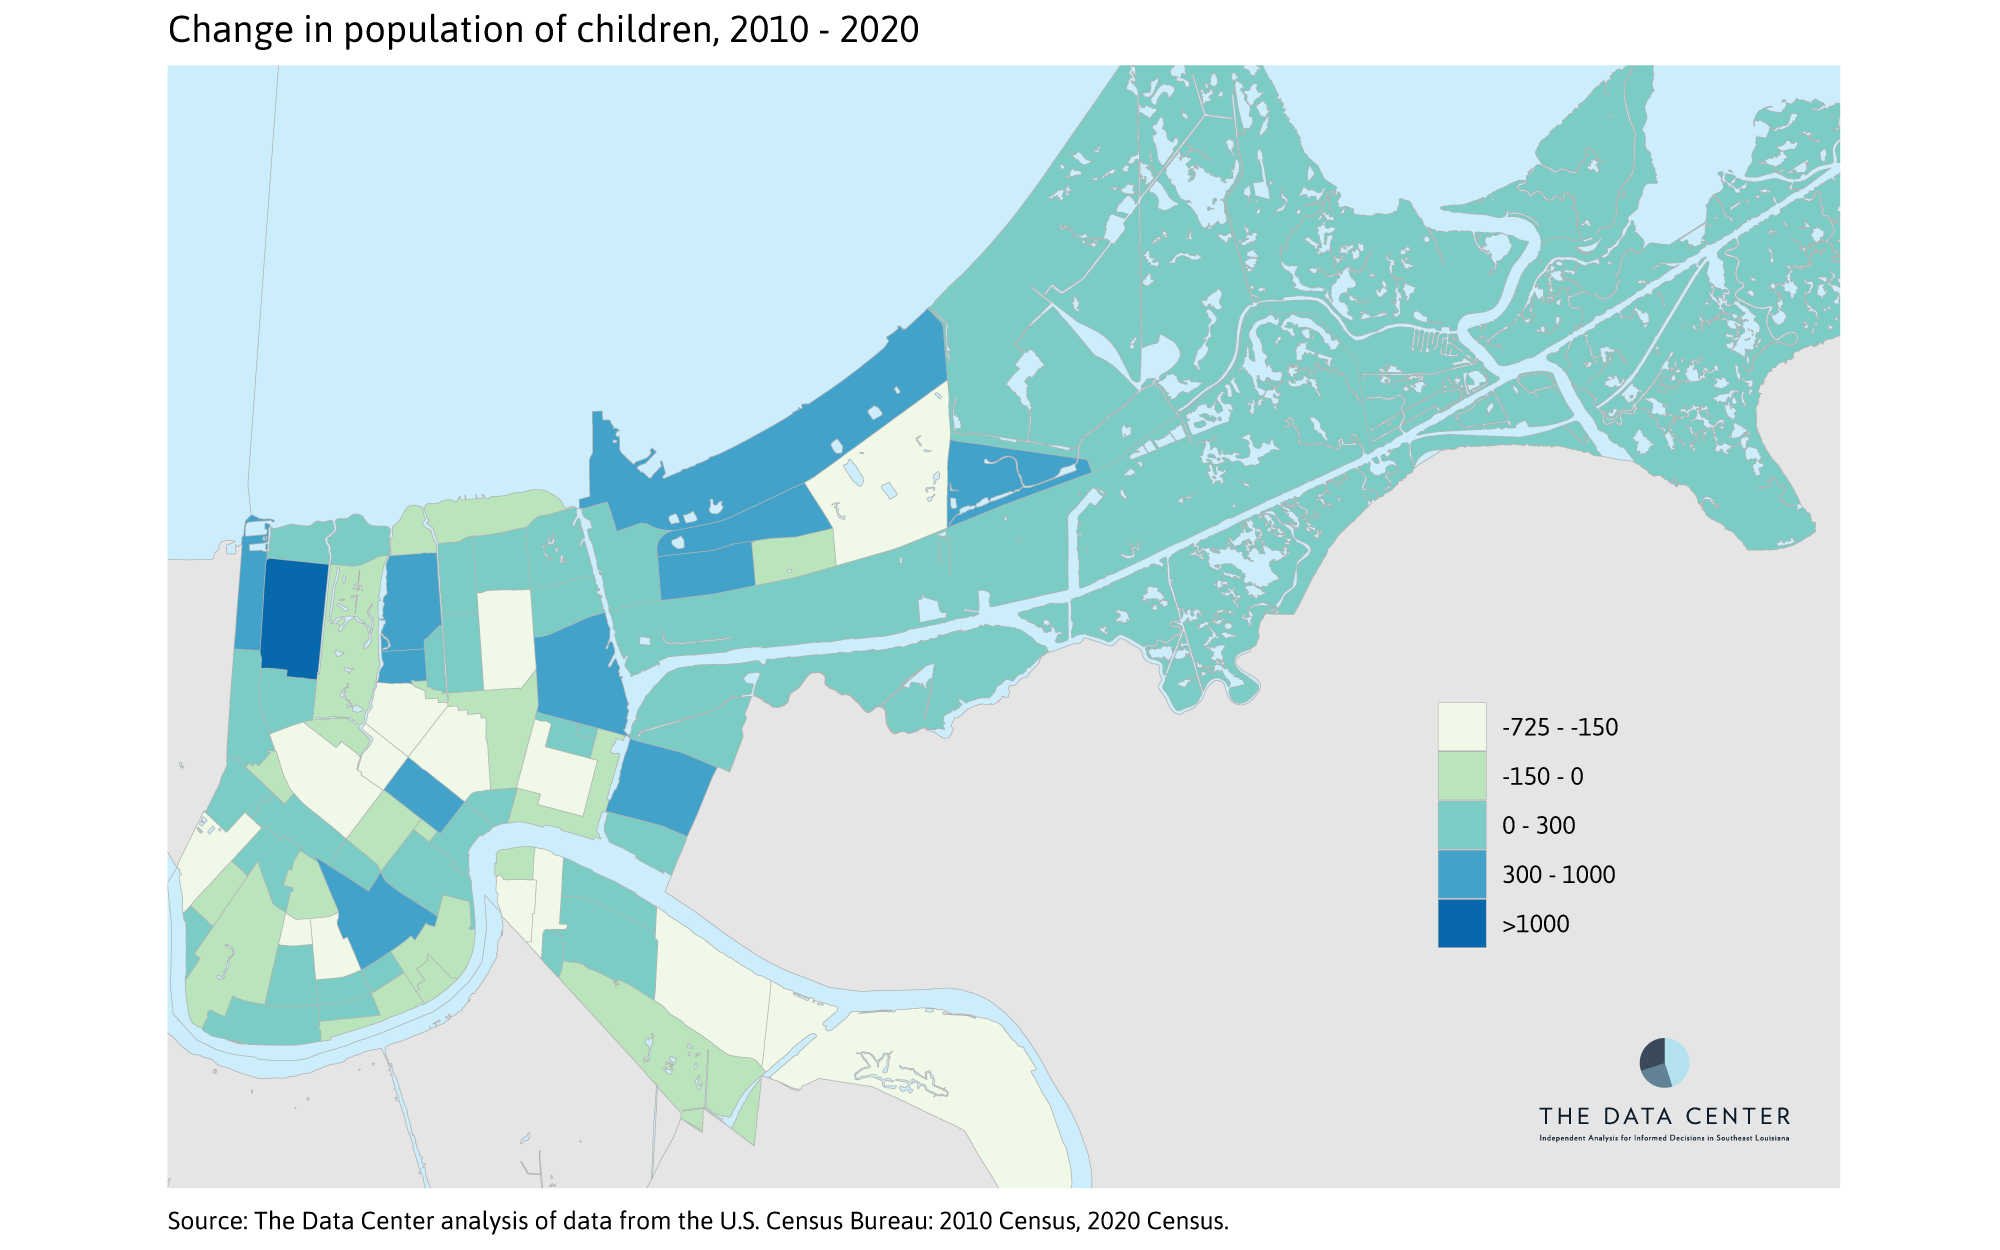
While the total number of children in New Orleans grew by less than 5,000, growth across neighborhoods was uneven with about half gaining children and the other half experiencing a decrease in children.
The number of children (under 18 years old) in New Orleans grew from 73,000 in 2010 to nearly 78,000 in 2020 but did not reach the city’s pre-Katrina number of children which was nearly 130,000. While the city’s increase in children (6 percent) may not seem large, it stood in contrast to the nation which experienced a 1.4 percent decline in children over the decade. Notably, adults in New Orleans grew 13 percent from 2010 to 2020, slightly ahead of the national 10 percent increase. The fact that both growth in adults and children outpaced the nation is likely due to continued post-Katrina recovery in the early part of the decade as mentioned above.
Lakeview gained more than 1,000 children. Other neighborhoods that flooded during Katrina including Village de l’Est, Lower Ninth Ward, Central City, Little Woods, Plum Orchard, St. Bernard Area, West End, Desire, Filmore, and West Lake Forest all gained between 300 and 1000 children. The child population gain in Village de l’Est is particularly notable because of the boundary change made by the Census Bureau which removed a portion of that neighborhood and merged it with the Lake Catherine neighborhood.
But many neighborhoods that flooded during Katrina did not see their child populations rebound between 2010 and 2020. For example, Freret, Read Blvd East, Bayou St. John, St. Claude, Fairgrounds, Leonidas, Gentilly Terrace, Mid-City, and Seventh Ward were all among neighborhoods that had at least 150 fewer children in 2020 than in 2010. Old Aurora had the largest decrease in child population, down more than 700 since 2010.
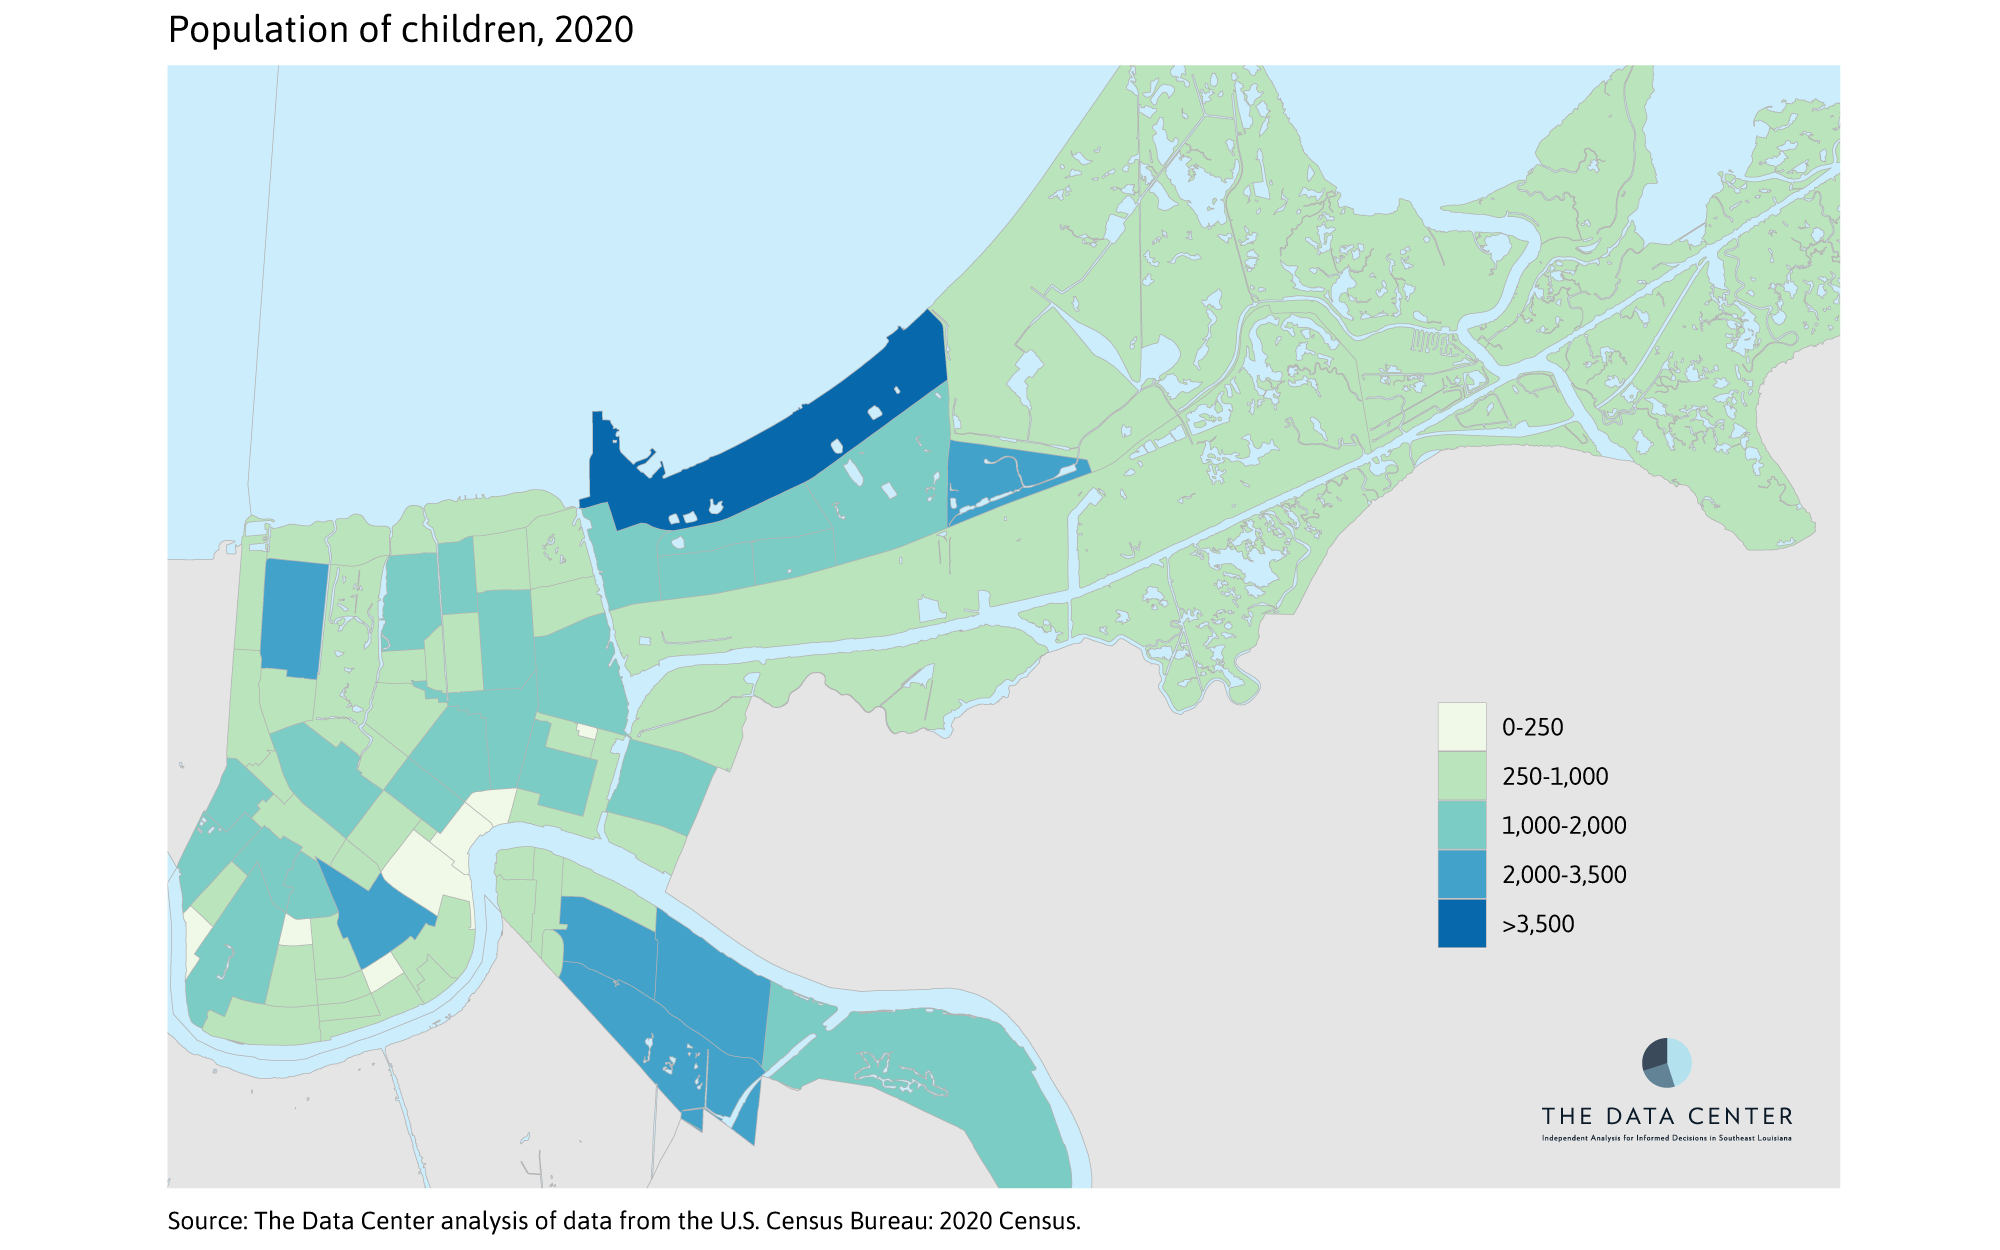
As of the 2020 Census, the large neighborhood of Little Woods had the most children totaling nearly 10,000. Old Aurora, Village de l’Est, Central City, Tall Timbers/Brechtel, Lakeview, and Behrman all had between 2,000 and 3,500 children. Another 21 neighborhoods had over 1,000 children. On the low end, seven neighborhoods had fewer than 250 children.
Limitations of the 2020 Census
Studies of the accuracy of every decennial census generally lag the release of the data by a couple of years, so we do not have a definitive sense yet of the quality of the 2020 Census. However, studies of earlier decennial censuses provide some insight about likely limitations of the 2020 Census. In 2010, the Census Bureau found that renters were undercounted by 1.1 percent while homeowners were overcounted by 0.6 percent. Non-Hispanic White individuals were overcounted by 0.8 percent, Black individuals were undercounted by 2.1 percent, and Hispanic individuals were undercounted by 1.5 percent. Young children (0-4 years of age) were undercounted by about 5 percent and are among the hardest segment of the population to accurately count. Undercounts of these groups were documented in the 1990 and 2000 decennial censuses as well.
In addition to the limitations described above, the data used in the analysis in this brief contains error or “noise” injected to adhere to federal laws that require the Census Bureau to protect the confidentiality of respondents. For the first time in 2020, they utilized a technique called Differential Privacy to protect the data. Differential Privacy requires a tradeoff between accuracy and privacy, and the Census Bureau has applied this methodology in such a way that data for small demographic groups in small geographies (such as census tracts/neighborhoods) could be inaccurate by more than 10 percent. As the data is aggregated into larger geographies, it becomes more accurate. However, this brief and the accompanying spreadsheet include data for small demographic groups in neighborhoods—data that contains some uncertainty because it may be more than 10 percent inaccurate. As such, readers and decisionmakers should be cautious about conclusions drawn based on small (<100) numbers.
“Vintage 2020 Population Estimates,” U.S. Census Bureau, accessed August 20, 2021, https://www.census.gov/programs-surveys/popest/technical-documentation/research/evaluation-estimates/2020-evaluation-estimates.html.
Mark Mather and Amanda Lee, “Children Are at the Forefront of U.S. Racial and Ethnic Change,” Population Reference Bureau, February 10, 2020, https://www.prb.org/resources/children-are-at-the-forefront-of-u-s-racial-and-ethnic-change.
Importantly, a relatively small portion of the Village de l’Est neighborhood was merged by the Census Bureau with Lake Catherine making comparisons from 2010 to 2020 somewhat imprecise.
Stella U. Ogunwole, Megan A. Rabe, Andrew E. Roberts, and Zoe Caplan, “U.S. Adult Population Grew Faster than Nation’s Total Population from 2010 to 2020,” U.S. Census Bureau, August 12, 2021, https://www.census.gov/library/stories/2021/08/united-states-adult-population-grew-faster-than-nations-total-population-from-2010-to-2020.html.
“Census Bureau Releases Estimates of Undercount and Overcount in the 2010 Census,” U.S. Census Bureau, May 22, 2012, https://www.census.gov/newsroom/releases/archives/2010_census/cb12-95.html.
“The Undercount of Young Children” U.S. Census Bureau, accessed August 20, 2021, https://www.census.gov/programs-surveys/decennial-census/decade/2020/planning-management/plan/undercount-of-young-children.html.
Barry Edmonston, “The Undercount in the 2000 Census,” Population Reference Bureau, May 2002, https://www.prb.org/wp-content/uploads/2002/05/undercount_paper.pdf.
“Assessing the Reliability and Variability of the TopDown Algorithm for Redistricting Data,” U.S. Census Bureau, accessed August 20, 2021, https://content.govdelivery.com/accounts/USCENSUS/bulletins/2e2545b. and “Production Settings Demonstration Data Released with Today’s Redistricting Data,” U.S. Census Bureau, accessed August 20, 2021, https://content.govdelivery.com/accounts/USCENSUS/bulletins/2ec43dd