Published: Aug 16, 2023
The geographies of poverty in New Orleans follow a consistent spatial pattern regardless of the indicator. Research shows that income, housing affordability, transportation, educational attainment, and family composition are all correlated with poverty.* The maps below depict these geographic patterns for New Orleans. To improve the reliability and usability of spatial displays of small area data on poverty, educational attainment, and other key indicators from the 2017-2021 American Community Survey, The Data Center developed a new method for estimating these values, with significant guidance from experts at Nielsen. Read the methodology for more details.
The geographies of poverty in New Orleans follow a consistent spatial pattern regardless of the indicator. The maps below show these geographic patterns for poverty, income, educational attainment, and more. Start with the poverty map to orient yourself and then explore the collection below.
 |
|
Percent of workers earning less than $1,250 per month
|
Percent of workers earning more than $3,333 per month
|
Commuting by Public Transit
|
No Vehicle
|
Cost-Burdened Renters
|
Low Educational Attainment
|
Single Parents
|
|
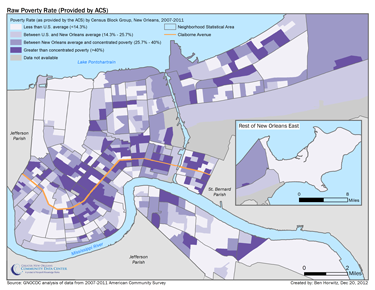
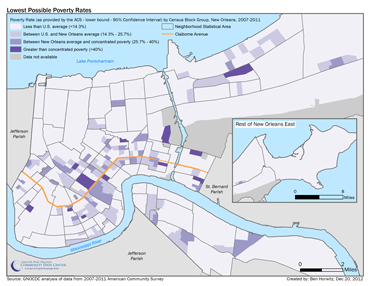
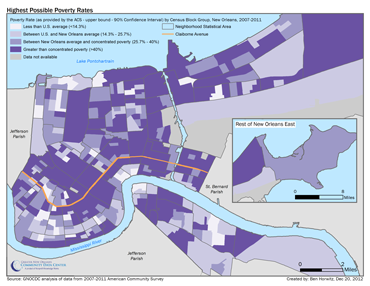
ACS small area data produce a very detailed and complex map of poverty in New Orleans — implying great precision in the data. (See “Raw Poverty Rate” map below.) However, we know that this data has high margins of error. For example, an area may have a 35 percent poverty rate plus or minus 28 percent — thus the true value lies somewhere between 7 and 63 percent. Use the vertical bar to explore maps of the highest possible poverty rates and the lowest possible poverty rates across the city.
Raw Poverty Rate (provided by ACS)
Explore Highest & Lowest Possible Poverty Rate
*Sources: Bauman, K.J. (1999).; Haskins, R. (2012).; Scarcella, C.A., Ehrle, J., & Geen, R. (2003).


