Shifts in Population and Loss of Children across the New Orleans Metro Area
Published: Feb 17, 2011
The population of metro New Orleans declined 11 percent since 2000, largely reflecting the significant job losses associated with Katrina and the Great Recession. However, population has shifted away from coastal and more damaged areas resulting in growth in the exurban parishes of St. Tammany, St. Charles, and St. John. At the same time, children under 18 represent only 23 percent of the total metro population down from 27 in 2000. This brief examines the growth and decline of all cities and towns in the metro area as well as the gain or loss of children in each.
The total population of any metro area is more a reflection of the strength of the economy than of available housing or other services. The main reason people move long distances, such as from one metro area to another metro area, is for job opportunities [1]. When jobs in a metro economy grow, total population will likely grow as well. When jobs shrink, regional populations also tend to shrink.
The population of the New Orleans seven–parish metro area has not grown significantly since the 1970s—the last time the regional economy enjoyed considerable job expansion. In that decade the metro added 175,000 jobs, growing its job base by 50 percent. The U.S. also grew jobs during the 1970s, but at nearly half the pace (27 percent) compared to the New Orleans metro [2]. Reflecting its relative economic prosperity, the metro area population grew 14 percent between 1970 and 1980, outpacing the nation’s growth rate of 11 percent.
But in the 1980s, the metro’s population shrank one percent as jobs declined by 10 percent between the peak of the oil boom in 1981 and the bottom of the oil bust in 1987. And from 1990 to 2000, the metro area population grew only sluggishly, by four percent, while the entire country grew 13 percent. Once again, these relatively weak population gains reflect relatively weak job growth. Between 1990 and 2000, jobs increased by only 16 percent in the New Orleans metro compared to 20 percent for the nation [3].
Since 2000, the metro population declined 11 percent, a reflection of the destruction of jobs associated with the Katrina disaster more than loss of housing. In August 2005, Hurricane Katrina and the levee failures displaced much of the metro area population and left only 36 percent of homes undamaged [4]. But at its lowest point in October 2005, the metro area still had 70 percent of its jobs intact [5]. Thus, there was significant demand for housing that was in short supply immediately after the storm. Many workers and their families returned to areas that were less damaged such as the north shore, upriver, and the west bank of Orleans Parish. By April 2010, the metro had regained 85 percent of its pre–Katrina jobs. And although Census 2010 results confirm there has been notable population growth in areas less damaged by Hurricane Katrina and the levee failures, the 2010 head count also reminds us that the overall population of the metro area is much smaller than it was ten years ago. In fact, the metro population is now nearly back to what it was in 1970.
In addition, the demographic make–up of the metro area is changing—with children under 18 years a declining share of the population. The total population shrank 11 percent during the most recent decade; but the number of adults declined only seven percent while the number of children declined 22 percent.
Taking a longer view, it is important to recognize that the metro area (and the United States) witnessed steep declines in the child share of the population in the 1970s and 1980s because of plummeting birth rates that began in the 1960s [6]. However, birth rates leveled off and the share of children in the metro area declined only slightly between 1990 and 2000, from 28 percent to 27 percent. Since 2000, the share of children has fallen to 23 percent of the metro area population, suggesting that families with children were less likely to return to the metro area compared to the general population.
Total Population and Share of Children under 18 Years, 1970 – 2010
New Orleans Metro
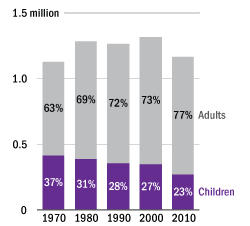
Sources: The Data Center compilation of data from U.S. Census Bureau.
Despite shrinking 11 percent since 2000, parts of the metro experienced growth as population shifted away from damaged areas.
The levee failures caused flooding to virtually all of St. Bernard Parish. It is no surprise then, that every area of the parish lost population over the last decade. Although St. Bernard does not have any incorporated cities or towns within the parish boundaries, there are five “census designated places” or CDPs: Arabi, Chalmette, Meraux, Violet and Poydras. From 2000 to 2010, the most downriver of these, Poydras, experienced the smallest percentage loss at 40 percent, while Arabi experienced the largest loss at 55 percent. But Chalmette, being the most populous CDP in the parish, lost the largest number of residents with the 2010 Census counting only 16,751 residents, down from 32,069 ten years earlier. Still, Chalmette remains the largest “place” in St. Bernard with 47 percent of the parish population.
(See below for reference map of cities, towns, and census designated places across the metro area and download the data table for complete statistics.)
From 2000 to 2010, the population of Plaquemines Parish shifted northward, away from Boothville, Buras, Empire, and Port Sulphur, each of which lost between 43 and 65 percent of their populations, while Belle Chasse grew by 29 percent. But the losses in the rest of the parish were greater than the 2,831 person increase in Belle Chase. The end result is that Belle Chase now represents 55 percent of Plaquemines’ diminished population, up from 37 percent in 2000.
In Jefferson Parish, nearly every one of the 21 cities, towns and CDPs lost population, except Gretna, Estelle, Waggaman and Elmwood, all of which grew slightly—from two to nine percent. Metairie and Kenner both lost five percent of their population. But the most severe percentage losses were in Lafitte (down 38 percent), Westwego (down 21 percent), Barataria (down 17 percent), and Grand Isle (down 16 percent). Despite these shifts, the distribution of population within the parish is not significantly changed with Metairie commanding 32 percent, and Kenner representing 15 percent of the Jefferson Parish population.
St. Tammany Parish experienced the largest population gain of any parish in the metro, increasing by 42,472 residents, or 22 percent. The vast majority of this population growth (86 percent) occurred in areas outside of an incorporated city or census designated place—largely because only 30 percent of St. Tammany’s population lives within a city or CDP (compared to 77 to 100 percent of the population for the other metro parishes). Among the parish’s incorporated areas and CDPs, Pearl River and Folsom grew the fastest at 36 percent. Covington grew only three percent, Slidell grew five percent, and Mandeville grew ten percent. But Covington, Slidell and Mandeville were the most populous places in 2000, thus, the raw population increases in these cities were greater than in Pearl River or Folsom. Despite significant storm damage, Slidell continues to be the largest city, town or CDP in St. Tammany with 27,068 people, or 12 percent of the parish’s total population. Mandeville continues to be second most populous with 11,560 residents, or 5 percent of the total.
In St. Charles Parish, population growth rates were greatest in Montz, which grew 71 percent, and Boutte, which grew 41 percent. In terms of raw numbers, St. Rose had the largest gains, growing from 6,540 to 8,122 residents. Nonetheless, Luling and Destrehan remain the most populous places with 23 and 22 percent of St. Charles’ population respectively.
In St. John the Baptist Parish, Laplace was the largest gainer, growing from 27,684 residents in 2000 to 29,872 in 2010. Although other places in St. John have grown in population, Laplace continues to represent the majority of the parish’s population at 65 percent.
(For details on population loss in New Orleans neighborhoods as well as a neighborhood reference map for neighborhood names and boundaries, please see Population Loss and Vacant Housing in New Orleans Neighborhoods available at https://www.datacenterresearch.org/reports_analysis/population-loss-and-vacant-housing/.)
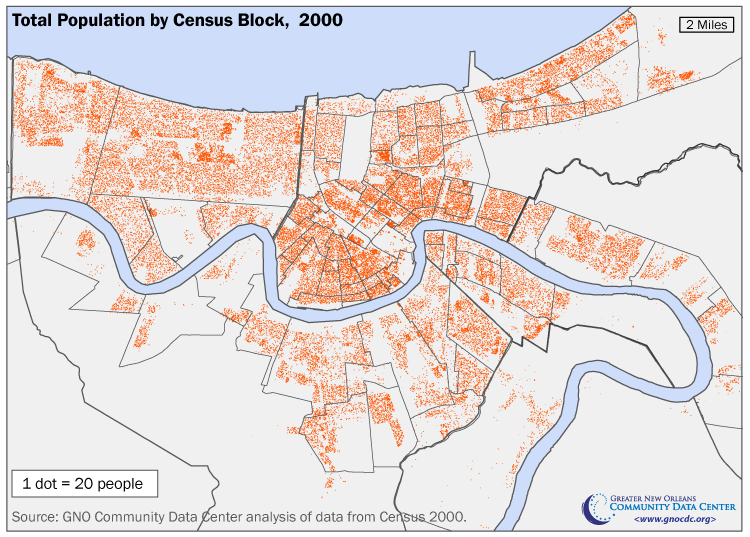
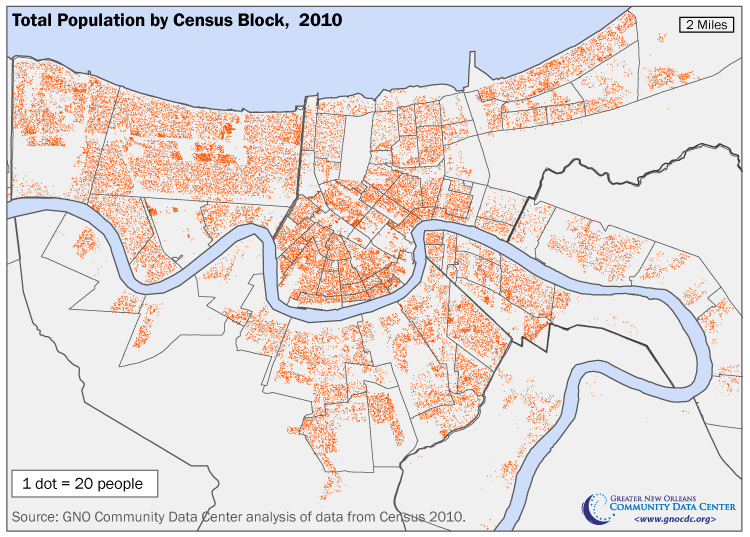
The following maps depict the change in population density across the main core of the metro area. Here you can see population gains in Belle Chase, thinning population across much of Jefferson Parish, and much reduced population density across most of New Orleans and St. Bernard.
Children are a declining share of the population in the vast majority of cities, towns and places in the metro area.
As described early, the decline in the metro area child population since 2000 has been more acute than the decline in the adult population. Between 2000 and 2010, the metro area lost 22 percent of children under 18 compared to only seven percent of all adults. Three of the four parishes that were impacted most severely by flooding in 2005 and lost total population—Orleans, Plaquemines, and Jefferson— experienced greater losses among children than among adults. The exception is St. Bernard Parish, where losses of children (46 percent) and adults (47 percent) were roughly equal. St. Charles and St. John the Baptist gained adults while losing children. St. Tammany gained both adults (27 percent) and children (11 percent), but the growth rate among adults was so much larger that the share of the St. Tammany population that is children has fallen from 28 percent to 26 percent.
Percent Change in Child and Adult Population, 2000–2010
by Parish and New Orleans Metro Area
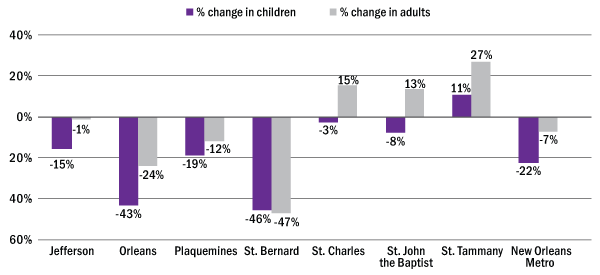
Sources: The Data Center compilation of data from U.S. Census Bureau.
The majority of cities, towns and places in the metro area lost children from 2000 to 2010. Kenner, Metairie and Chalmette each lost more than 3,000 children. Marrero, Harvey, Terrytown, Westwego, Woodmere, Violet, and Meraux each lost between 1,000 and 2,200 children. The only place in Plaquemines that gained children was Belle Chase (910), and the only place in Jefferson was Elmwood (149).
St. Tammany Parish is the only parish in the metro area to record an increase in children since 2000, gaining 5,737 children. Because 70 percent of the population of St. Tammany lives in unincorporated areas not designated as “places” by the Census Bureau, nearly all of the growth in children (98 percent) occurred in areas outside of cities, towns, or census designated places. Among cities and census designated places, the largest gains in children were in Pearl River and Eden Isle. But these two places gained only 128 and 126 children respectively. Mandeville, Slidell, and Covington each lost between 6 and 179 children.
(For details on loss in children from New Orleans neighborhoods as well as a neighborhood reference map for neighborhood names and boundaries, please see The Loss of Children From New Orleans Neighborhoods, available at https://www.datacenterresearch.org/reports_analysis/the-loss-of-children-from-new-orleans-neighborhoods/)
The following maps compare the density of children in the main core of the metro area in 2000 and 2010 and graphically display the significant losses of children experienced in this area.
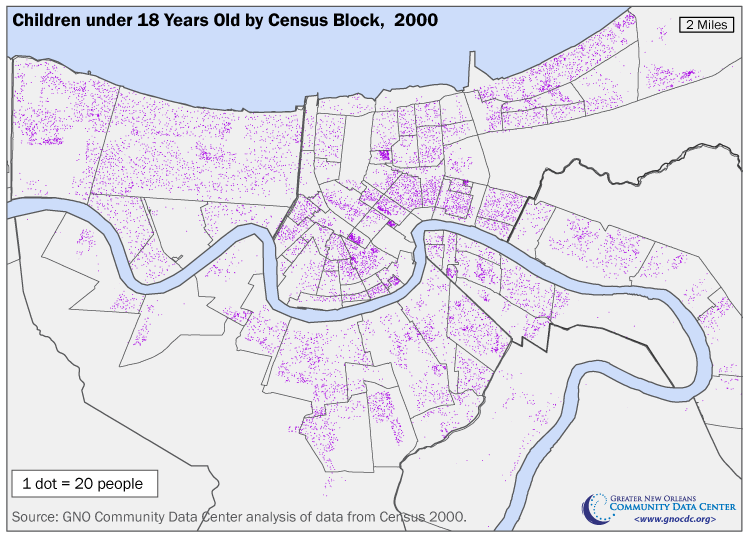
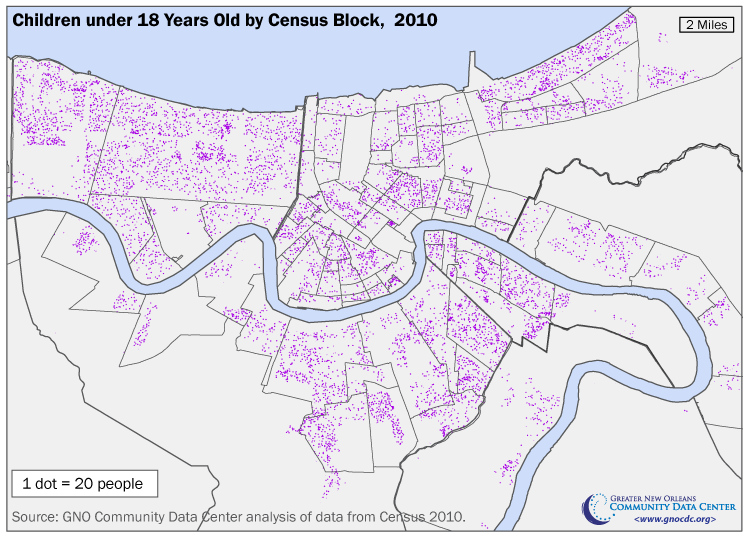
Source: The Data Center analysis of data from Census 2000 and 2010 and USGS National Landcover Database 2001.
Notes: CDP = Census Designated Place (concentrations of population in unincorporated areas that are designated by the Census Bureau for statistical purposes). Des Allemands CDP is only partially within St. Charles Parish. na = not available. The sum of all places within a parish does not equal the total for that parish, due to additional area contained within each parish. The sum of all parishes does equal the total for the Metro Area.
* The area within these places decreased between 0.1 square miles and 8.4 square miles between 2000 and 2010. As a result, population changes between 2000 and 2010 may partially reflect these boundary changes in addition to actual changes in the population from births, deaths, and migration.
** The area within these places increased between 0.1 square miles and 10 square miles between 2000 and 2010. As a result, population changes between 2000 and 2010 may partially reflect these boundary changes in addition to actual changes in the population from births, deaths, and migration.
*** Population data for Venice CDP is included as part of Boothville CDP in Census 2000, and data for Triumph CDP is included as part of the Buras CDP in Census 2000.
Limitations of the decennial census
Studies of the accuracy of the Census 2010 count will not be undertaken until more Census 2010 data has been released. However, studies of earlier decennial censuses provide guidance as to likely limitations of the Census 2010. A state–specific study of the Census 2000 undercount conducted by PricewaterhouseCoopers concluded that Louisiana’s population in 2000 was undercounted by 60,698 or 1.34 percent [7]. Studies of both the 1990 and 2000 decennial censuses concluded that American Indians, Asians, African Americans, Hispanics, and children were most likely to be undercounted [8]. And a study of the 2000 decennial census concluded that some people were double counted, including college students living away from home, and families counted at both their main and vacation homes. These people were more likely to be white and higher–income [9].
Look for more data on children this summer
The Data Center will publish more analyses of children by detailed age groups this summer when the Census makes this data available.
[1] Based on surveys conducted by the Census Bureau, employment–related reasons are the primary reason why people move distances of greater than 50 miles. For example, among people in the United States who moved between 200 and 499 miles, 54 percent moved for an employment–related reason compared to 19 percent for a family–related reason and 14 percent for a housing–related reason. Employment–related reasons include a new job or job transfer, to look for work, to be closer to work, retirement, and other job–related reasons. See U.S. Census Bureau,“Geographic Mobility: 2008 to 2009” (Table 27), accessed online at http://www.census.gov/population/www/socdemo/migrate/cps2009.html.
[2] U.S. Bureau of Labor Statistics and Moody’s Economy.com Database (U.S. Bureau of Labor Statistics: CES, QCEW)
[3] Ibid.
[4] Office of the Federal Coordinator for Gulf Coast Rebuilding, Department of Homeland Security,“Current Housing Unit Damage Estimates: Hurricane Katrina, Rita and Wilma,” February 12, 2006 (Revised April 7, 2006), accessed online at https://gnocdc.s3.amazonaws.com/reports/Katrina_Rita_Wilma_Damage_2_12_06___revised.pdf
[5] U.S. Bureau of Labor Statistics, Current Employment Statistics.
[6] Centers for Disease Control and Prevention/ National Center for Health Statistics, “Vital Statistics of the United States, 2003” (Table1–1), accessed online at http://www.cdc.gov/nchs/data/statab/natfinal2003.annvol1_01.pdf. Also see U.S. Census Bureau, “Children’s Living Arrangements and Characteristics: March 2002,” June 2003, accessed online at http://www.census.gov/prod/2003pubs/p20-547.pdf)
[7] PricewaterhouseCoopers,“Effect of Census 2000 Undercount on Federal Funding to States and Selected Counties, 2002–2012,” August 7, 2001, accessed online at http://govinfo.library.unt.edu/cmb/cmbp/reports/080601.pricewaterhouse/state_la.asp.htm
[8] Edmonston, Barry. “The Undercount in the 2000 Census,” The Annie E. Casey Foundation and The Population Reference Bureau, May 2002, accessed online at http://www.aecf.org/upload/publicationfiles/undercount%20in%202000%20census.pdf
[9] Ericksen, Eugene.“An Evaluation of the 2000 Census and Census Bureau Efforts to Measure the Gross and Net Rates of Undercount,” 2001, North Dakota Law Review, 77 (753).
Suggested Citation: The Data Center analysis of U.S. Census Bureau, Decennial Census