Facts for Features: Katrina Recovery
Allison Plyer
Published: Aug 28, 2015
Ten years after Hurricane Katrina, what does the very latest data say about how New Orleans and the region are doing?
NEW ORLEANS — August 28‚ 2013 — Eight years after Hurricane Katrina, five years after the onset of the Great Recession, and three years after the Deepwater Horizon oil spill, what does the very latest data say about how the city and region are doing?
New Orleans is a smaller city but is still growing.
- As of July 2012, the U.S. Census Bureau has estimated New Orleans’ population at 369,250, or 76 percent of its 2000 population of 484,674. The metro area, with 1,205,374 residents, has 92 percent of its 2000 population of 1,316,510.[1]
- According to the Census Bureau, the population of New Orleans and the metro area grew by 2 percent (8,909 people) and 1 percent (13,733 people), respectively, between July 2011 and July 2012.
- As of June 2013, Valassis, Inc. data on households receiving mail indicates that just over half (37) of New Orleans’ 72 neighborhoods have recovered 90 percent of their June 2005 population, and 13 neighborhoods have more population than they did in June 2005.
The New Orleans metro is taking the first steps toward a new path, with signs of a more competitive economy and expanded amenities.
- The New Orleans metro has weathered the Great Recession impressively. As of 2012, the New Orleans metro had recovered all its recession–era losses and reached 1 percent above its 2008 employment level while the nation remained 2 percent below its 2008 job level.
- The New Orleans area has experienced notable growth in knowledge–based industries, including higher education and insurance services, while maintaining older industrial strengths. For example, heavy construction and engineering has expanded significantly and could supply the skilled workforce needed for new economic transformations in the region.
- Entrepreneurship in the New Orleans metro continues to expand, reaching 501 business startups per 100,000 adults in the three–year period ending in 2012 — a rate that exceeds the nation by 56 percent.
- During the 2012–13 school year, 63 percent of New Orleans’ public school students attended schools that pass state standards, up from about 30 percent pre–Katrina.
- Bicycle lanes and pathways are growing exponentially in New Orleans — now at 56.2 miles compared to the 10.7 miles that existed in 2004.
But it’s important to remember that New Orleans has sustained three shocks since 2005: Katrina and the levee failures, the Great Recession, and the Deepwater Horizon oil spill.
- Single–family home sales in the region fell from 5,826 in the first six months of 2007 to 4,823 during the same months of 2013, reflecting continued weaknesses in the national housing market. Louisiana mortgages in foreclosure have risen from 2.1 percent in December 2008 to 2.7 percent in June 2013.
- The poverty rate in the New Orleans metro declined from 18 percent in 1999 to 15 percent in 2007, but then increased to 19 percent in 2011, such that it is now statistically unchanged since 1999. In New Orleans itself, the 2011 poverty rate of 29 percent is also statistically the same as in 1999 after falling to 21 percent in 2007.
- Like the overall poverty rate, child poverty rates in Orleans Parish and the metro area dropped in 2007 but have since increased again to their 1999 level. In 2011, the child poverty rate was 42 percent in the city and 28 percent in the metro, both higher than the U.S. rate of 23 percent.
- The oil spill and moratorium undercut key industries that drive the New Orleans regional economy such that there are 1 percent fewer natural resources and mining jobs in May 2013 as compared to four years earlier, even as such jobs increased nationally by 25 percent.
Key economic, social, and environmental trends in the New Orleans metro area remain troubling.
- Adult educational attainment, a key factor influencing success in today’s economy, is not being advanced in the New Orleans metro at the same rate as in the nation, especially for black men, who have experienced no increase since 2000 in the percent obtaining bachelor’s degrees.
- Post–Katrina housing is unaffordable with 54 percent of renters in the city paying more than 35 percent of their pre–tax income on rent and utilities in 2011, up from 43 percent of renters in 2004.
- In 2011, the rate of violent crimes per 100,000 residents was 792 in New Orleans, double the 2011 national rate of 386.
- Between 1932 and 2010, the New Orleans region lost 948 square miles of coastal wetlands, which is nearly 30 percent of the wetlands that protect the New Orleans area from hurricane storm surge.
FEMA dollars are still flowing to localities, but Road Home grants and FEMA trailers are ending.
- As of August 2013, FEMA has obligated $10.3 billion for debris removal and infrastructure repairs for the New Orleans metro, with $6.9 billion paid to localities and $3.4 billion still forthcoming.
- As of August 8, 2013, the state has disbursed $8.99 billion in Road Home grants to 130,009 pre–Katrina homeowners. About 8 applications are still pending.
- As of July 2012, zero families in Louisiana are living in FEMA trailers, down from more than 70,000 in August of 2006.
The city and region have experienced demographic shifts post–Katrina.
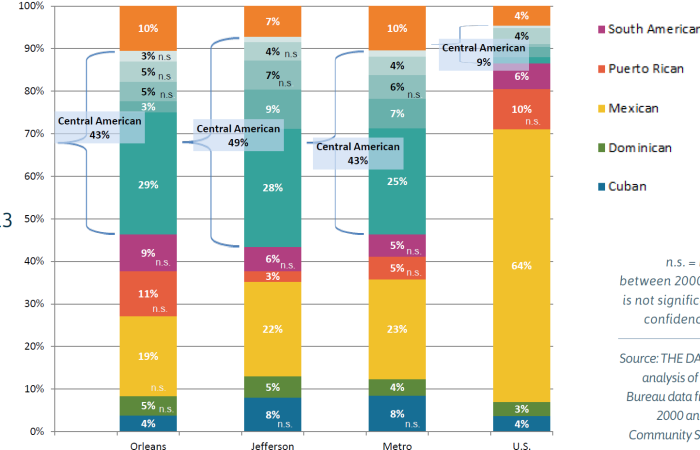
- The New Orleans metro area is more diverse than in 2000 with a gain of 40,577 Hispanics and 5,582 additional Asian residents. The Latino population in the metro spiked 69 percent between 2000 and 2012 — a rate greater than the nation’s 50 percent growth.
- In the city, the Census Bureau estimated 103,881 fewer African Americans in 2012 compared to 2000, but also 14,984 fewer whites and 4,830 more Hispanics. Nonetheless, African Americans still represent the majority of the city’s population at 59 percent, down from 67 percent in 2000.
Be sure to cite The Data Center:
your source for the most up–to–date, reliable data.
For further analysis and recommendations from The Data Center, see The New Orleans Index at Eight at www.datacenterresearch.org.
About The Data Center
The Greater New Orleans Community Data Center makes informed decisions possible. For the past 15 years, we have been both a trusted resource and an objective partner in bringing reliable, thoroughly researched data to conversations about building a prosperous, inclusive, and sustainable region. The Data Center has played a critical role in assessing the strength of the New Orleans and Southeast Louisiana economy since the onset of the Great Recession. The Data Center is also recognized across the country for expertise in New Orleans demographics, disaster recovery indicators, and actionable data visualization.
Notes
[1] The New Orleans metro is defined according to the 2009 delineations of the Office of Management and Budget, which is the 7–parish area including Jefferson, Orleans, Plaquemines, St. Bernard, St. Charles, St. John, and St. Tammany parishes.
Sources: U.S. Census Bureau; Valassis, Inc.; U.S. Bureau of Labor Statistics; Moody’s Analytics (U.S. Bureau of Labor Statistics: CES, QCEW); Kauffman Index of Entrepreneurial Activity; Louisiana Department of Education; Regional Planning Commission for Jefferson, Orleans, Plaquemines, St. Bernard, and St. Tammany Parishes; New Orleans Metropolitan Association of Realtors; Mortgage Bankers Association; Federal Bureau of Investigation; U.S. Geological Survey; Federal Emergency Management Agency; and The Road Home Program.
New Orleans is a smaller city but continues to grow nearly ten years after Katrina.
- As of July 2014, the U.S. Census Bureau has estimated New Orleans’ population at 384,320, or 79 percent of its 2000 population of 484,674. The metro area, with 1,251,849 residents, has 94 percent of its 2000 population of 1,337,726.1
- According to the Census Bureau, the population of New Orleans and the metro area grew by 5,314 people and 9,900 people, respectively, between July 2013 and July 2014.
- As of June 2015, Valassis, Inc. data on households receiving mail indicates that more than half (40) of New Orleans’ 72 neighborhoods have recovered 90 percent of their June 2005 population, and 16 neighborhoods have more population than they did in June 2005.
Metro New Orleans is taking the first steps toward a new path, with signs of a more competitive economy and expanded amenities.
- New Orleans’ sales tax revenue for Jan-May 2015 was 29 percent higher than for the same months in 2005 pre-Katrina (despite the city’s smaller population today), and 49 percent higher than in 2009 at the depth of the Great Recession.2
- Metro New Orleans has rebounded from the Great Recession impressively. As of 2014, metro New Orleans had reached 5 percent above its 2008 recession-era employment level while the nation had reached just 1 percent above its 2008 job level.
- Entrepreneurship in metro New Orleans at 471 business startups per 100,000 adults in the three-year period ending in 2013 exceeds the nation by 64 percent.
- Bikeways and trails (including shared lanes) are growing exponentially in New Orleans. As of 2014, the city had 92.4 miles of bikeways as compared to the 10.7 miles that existed in 2004.
But it’s important to remember that New Orleans has sustained several shocks since 2005, including the Great Recession.
- The poverty rate in metro New Orleans declined from 18 percent in 1999 to 15 percent in 2007, but then increased to 19 percent in 2013, such that it is now statistically unchanged since 1999. In New Orleans itself, the 2013 poverty rate of 27 percent is also statistically the same as in 1999 after falling to 21 percent in 2007.
- Like the overall poverty rate, child poverty rates in the city and the metro area dropped in 2007 but have since increased. In 2013, the child poverty rate was 39 percent in New Orleans (statistically unchanged since 1999) and 29 percent in the metro (higher than in 1999) — both higher than the U.S. rate of 22 percent.
Key economic, social, and environmental trends in metro New Orleans area remain troubling.
- Adult educational attainment, a key factor influencing success in today’s economy, is not being advanced in metro New Orleans at the same rate as in the nation. The share of the population 25 years and older with a bachelor’s degree or higher increased from 23 to 27 percent in metro New Orleans from 2000 to 2013, while across the U.S. it increased from 24 to 30 percent.
- During the same 2000 to 2013 period, black men in metro New Orleans experienced no improvement in the percent obtaining bachelor’s degrees or higher. As of 2013, only 12 percent of black men, compared to 35 percent of white men and 19 percent of black women, had a bachelor’s degree. Meanwhile, 34 percent of white women in the metro had a bachelor’s degree or higher.
- Post–Katrina housing is unaffordable with 37 percent of renters in the city paying more than 50 percent of their pre–tax income on rent and utilities in 2013, up from 24 percent of renters in 2004.
- Between 1932 and 2010, the New Orleans region lost 948 square miles of coastal wetlands, which is nearly 30 percent of the wetlands that protect the New Orleans area from hurricane storm surge.
The city and region have experienced demographic shifts post–Katrina.
- Metro New Orleans area is more diverse than in 2000 with a gain of 47,649 Hispanics and 7,623 additional Asian residents. The Hispanic population in the metro spiked 81 percent between 2000 and 2014.
- According to the U.S. Census Bureau’s 2014 population estimates, there are now 97,385 fewer African Americans living in the city of New Orleans compared to 2000, but there are also 9,006 fewer whites. Meanwhile, the number of Hispanics grew by 6,474. In New Orleans, the share of the 2013 population that is African American — while lower than in 2000 when it was 66.7 percent — continues to represent the majority of city residents at 58.8 percent.
- While the city has 97,395 fewer black residents, the metro area as a whole has only 66,752 fewer black residents, revealing that the suburban parishes have gained more than 30,000 blacks. Moreover, the metro area as whole has had a net loss of 75,228 white residents. In short, the metro area as a whole is increasingly diverse with gains in blacks, Hispanics, and Asians and losses of white residents in nearly every parish.3
Be sure to cite The Data Center:
your source for the most up–to–date, reliable data.
For further analysis and recommendations from The Data Center, see
The New Orleans Index at Ten at
www.datacenterresearch.org;
About The Data Center
The Data Center is the most trusted resource for data about greater New Orleans and Southeast Louisiana. Since 1997, The Data Center has been an objective partner in bringing reliable, thoroughly researched data to conversations about building a more prosperous, inclusive, and sustainable region. The Data Center (formerly known as the Greater New Orleans Community Data Center) became the local authority for tracking post-Katrina recovery with The New Orleans Index, developed in partnership with the Brookings Institution.
Notes
- Metro New Orleans is defined according to the 2013 delineations of the Office of Management and Budget, which is the 8-parish area including Jefferson, Orleans, Plaquemines, St. Bernard, St. Charles, St. John, St. James, and St. Tammany parishes.
- These figures are not adjusted for inflation.
- “African American/ Black,” “Asian,” and “white” refer to individuals who report to be only one race and not Hispanic. However, “Hispanics” can be of any race(s).
Sources: U.S. Census Bureau; Valassis, Inc.; City of New Orleans; U.S. Bureau of Labor Statistics; Moody’s Analytics (U.S. Bureau of Labor Statistics: CES, QCEW); Kauffman Index of Entrepreneurial Activity; Regional Planning Commission for Jefferson, Orleans, Plaquemines, St. Bernard, and St. Tammany Parishes; and U.S. Geological Survey.
More