Who Lives in New Orleans and Metro Parishes Now?
Published: Sep 26, 2025
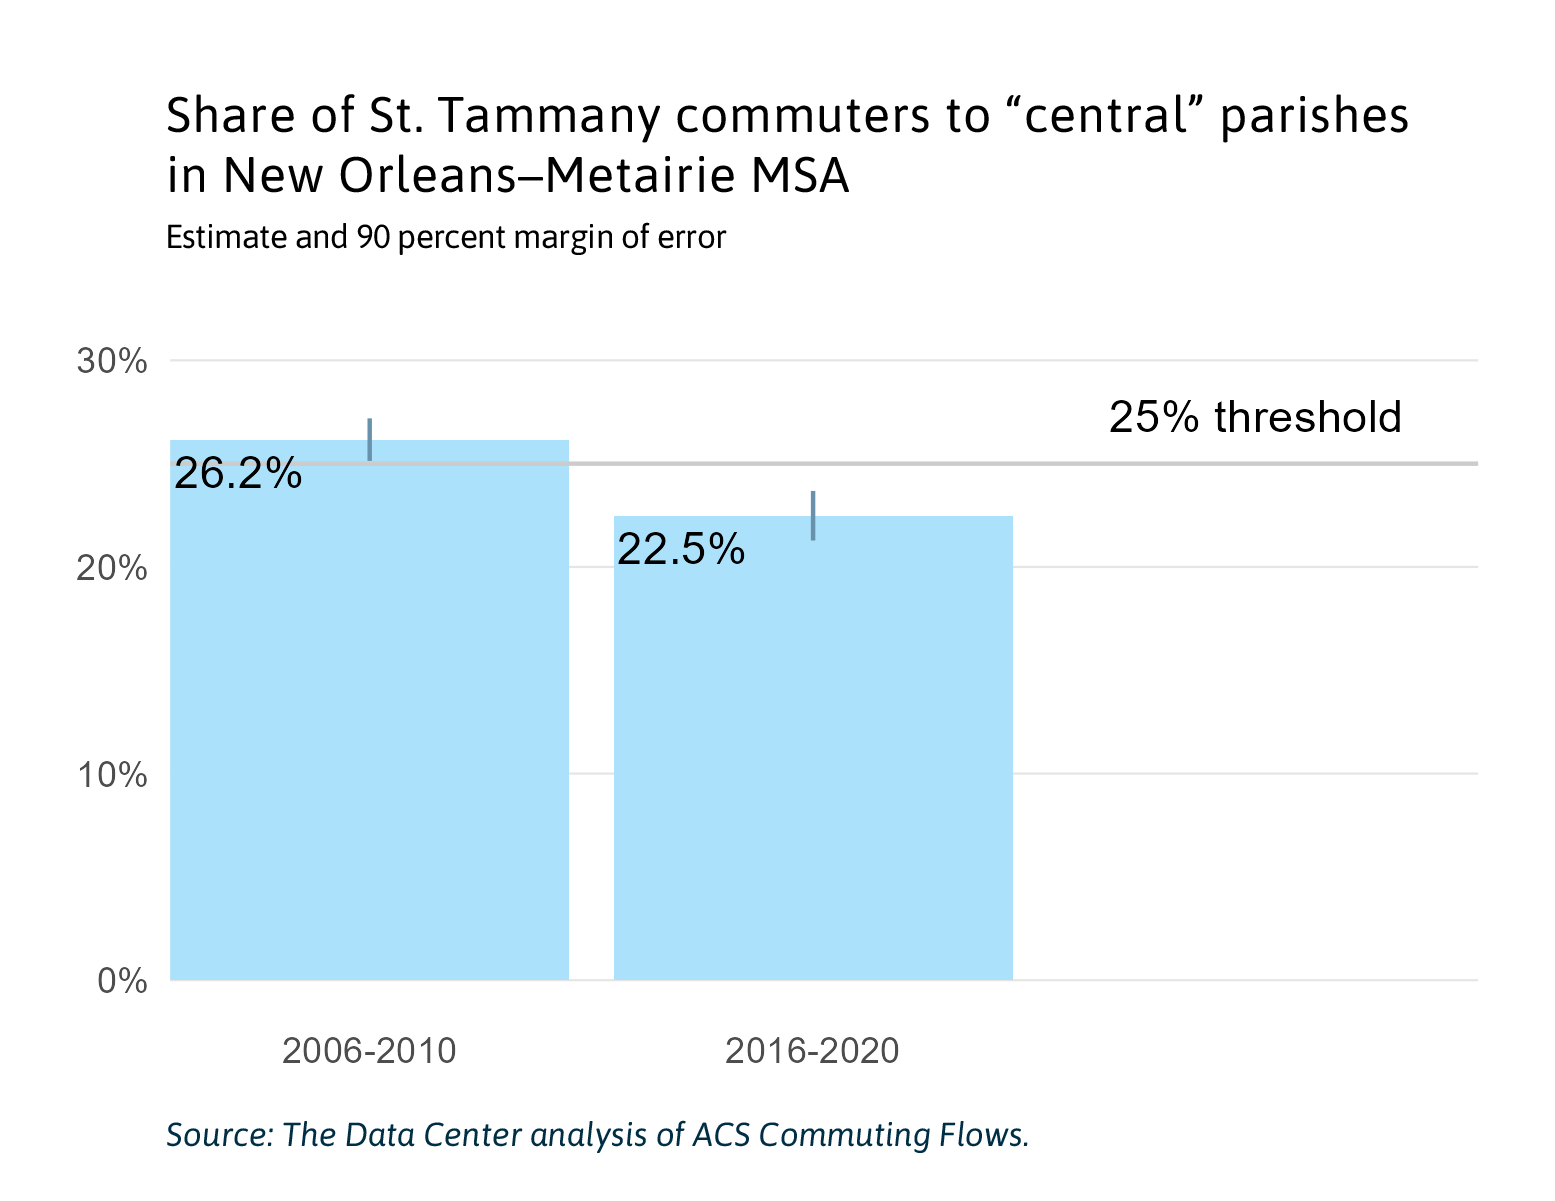
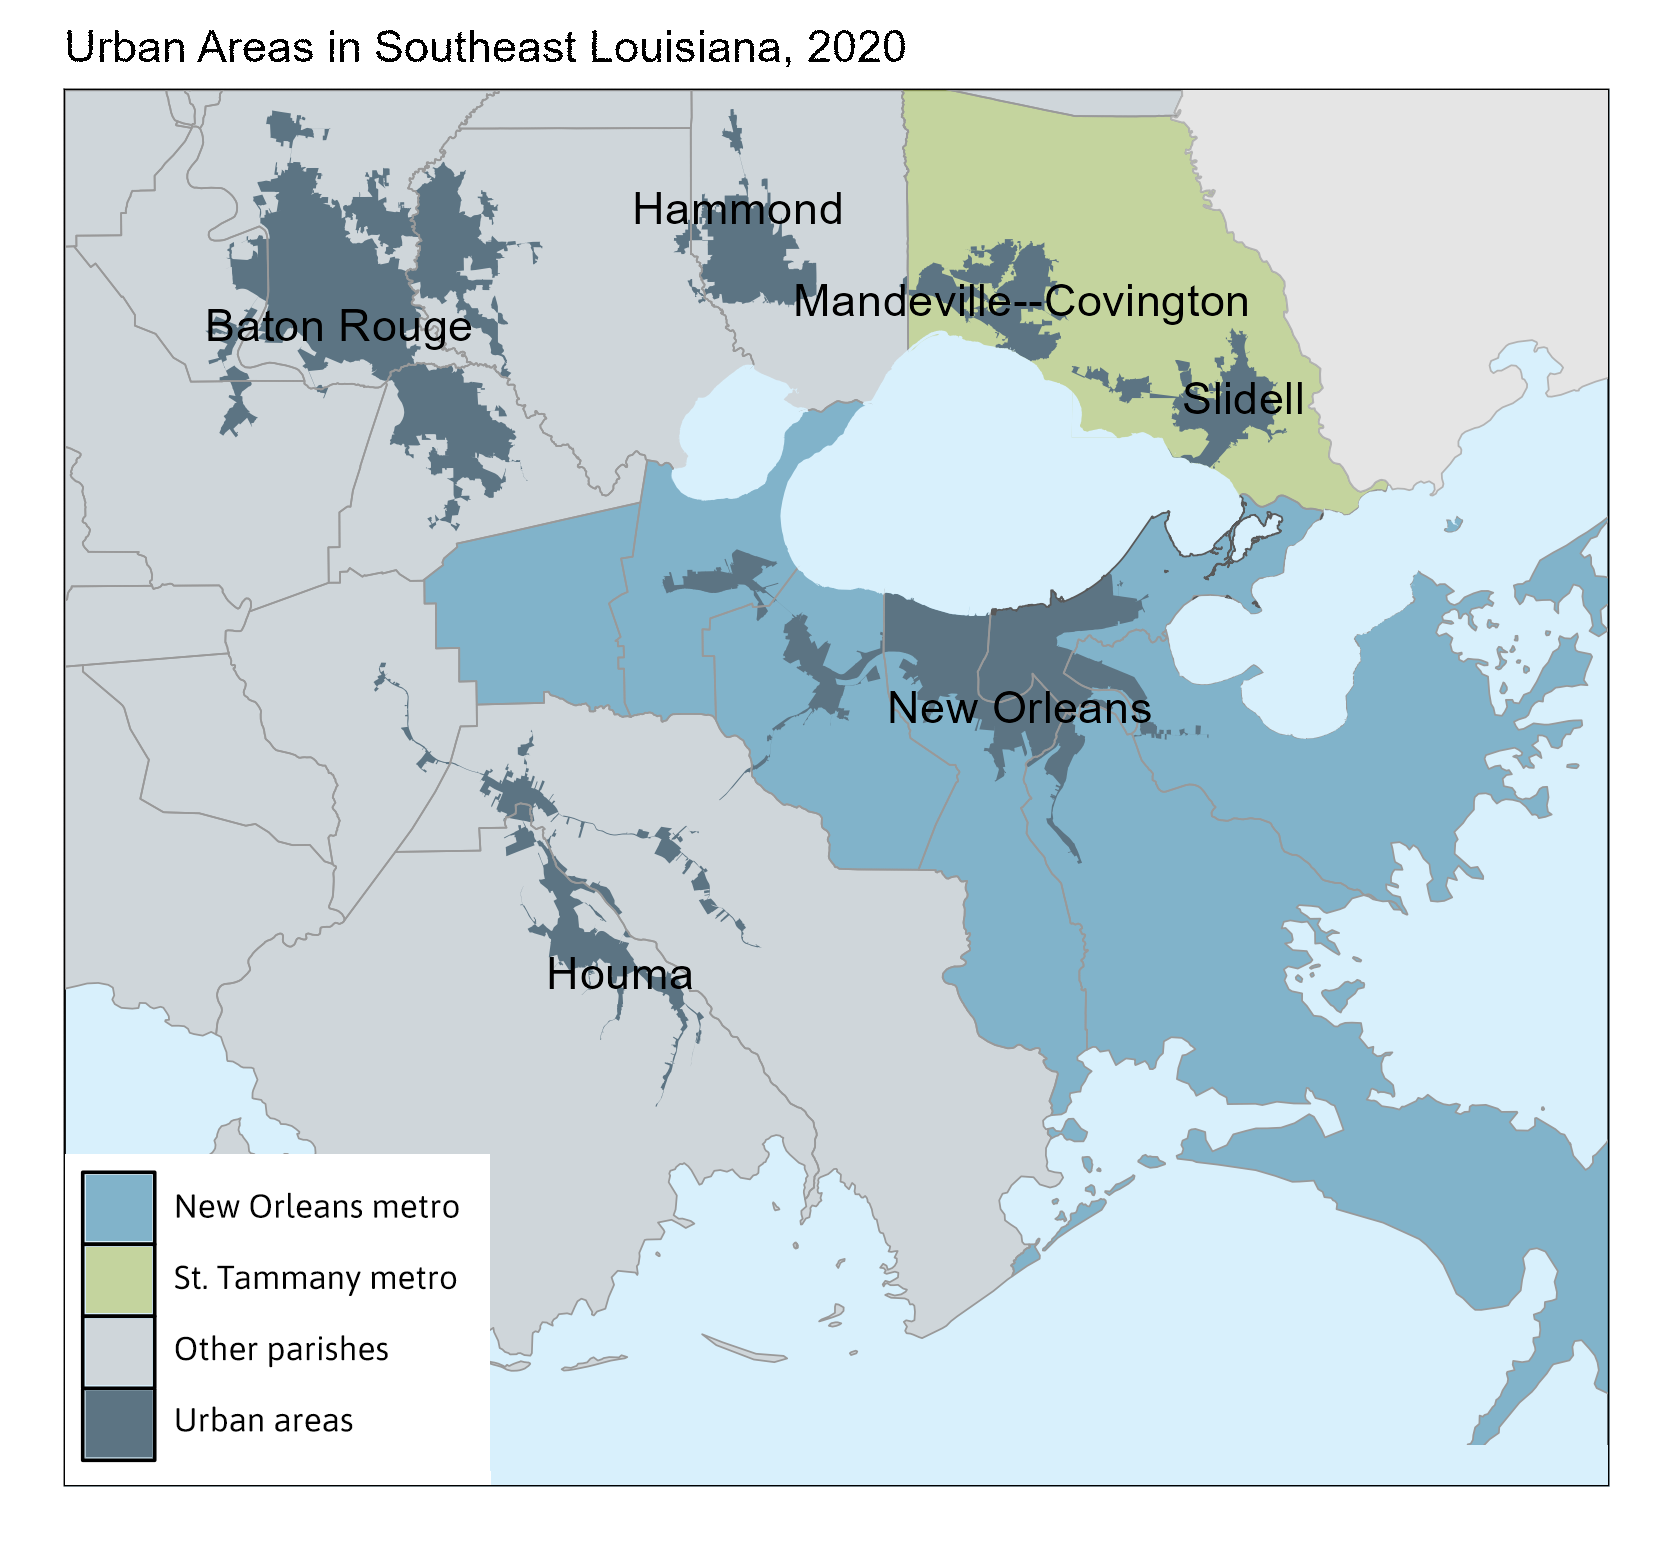
This brief examines the 2024 demographic data released by the U.S. Census Bureau covering race, ethnicity, and age. This brief also covers 2024 estimates from the Census Bureau’s annual American Community Survey (ACS) on a range of important topics such as educational attainment, poverty, and housing costs. In 2023, the official definition of the New Orleans metro area changed to exclude St. Tammany, because a smaller portion of workers who live in St. Tammany are commuting to work in Orleans, Jefferson, and other parishes on the south shore of Lake Pontchartrain. To learn more about how metro areas are defined and how this change came about read this Research Note.
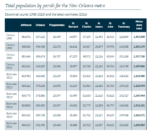
The U.S. Census Bureau estimates that 966,230 residents were living in the 7-parish New Orleans metro as of July 2024, a 4.1 percent decrease from April 2020.1 The metro area now has 84 percent of its 2000 population of 1,146,458. In this brief, we examine demographic data released by the U.S. Census Bureau and identify important changes in metro area parishes since 2000 (or the best benchmark available).
Race/Ethnicity
Compared to 2000, pre-Katrina, there are now 123,701 fewer Black residents living in New Orleans (Orleans Parish), and there are 24,366 fewer White residents, as well as 16,181 more Hispanic residents.2
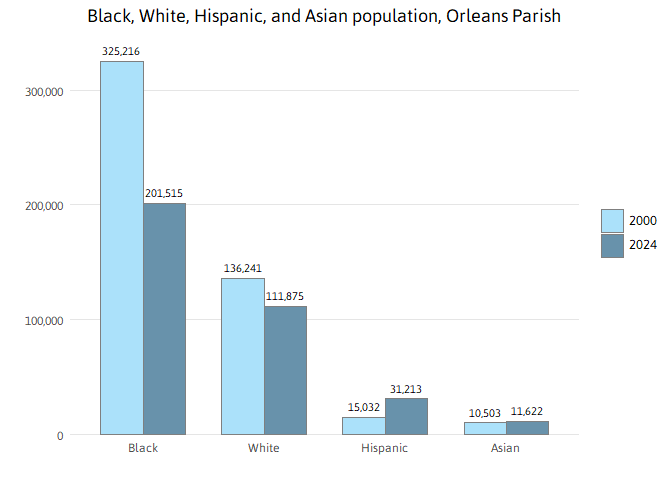
Source: The Data Center analysis of U.S. Census Bureau data from Census 2000 and Population Estimates 2024.
What is Orleans Parish?
Orleans Parish is the city of New Orleans. New Orleans and Orleans Parish are interchangeable. Their boundaries are the same, and they contain the same population.
In Orleans Parish, the share of the 2024 population that is Black — while lower than in 2000 when it was 67 percent — continues to represent the majority of city residents at 56 percent. The share of Hispanic residents in the city increased from 3 percent in 2000 to 9 percent in 2024; the share of Asian residents increased from 2 percent to 3 percent; and the share of White residents increased from 28 percent to 31 percent. Meanwhile, Hispanic, Asian, and Black populations increased as a share of the total population in Jefferson, St. Bernard, St. Charles, and St. John the Baptist parishes. In fact, the number and share of Hispanics have increased in all seven parishes in the metro area since 2000.
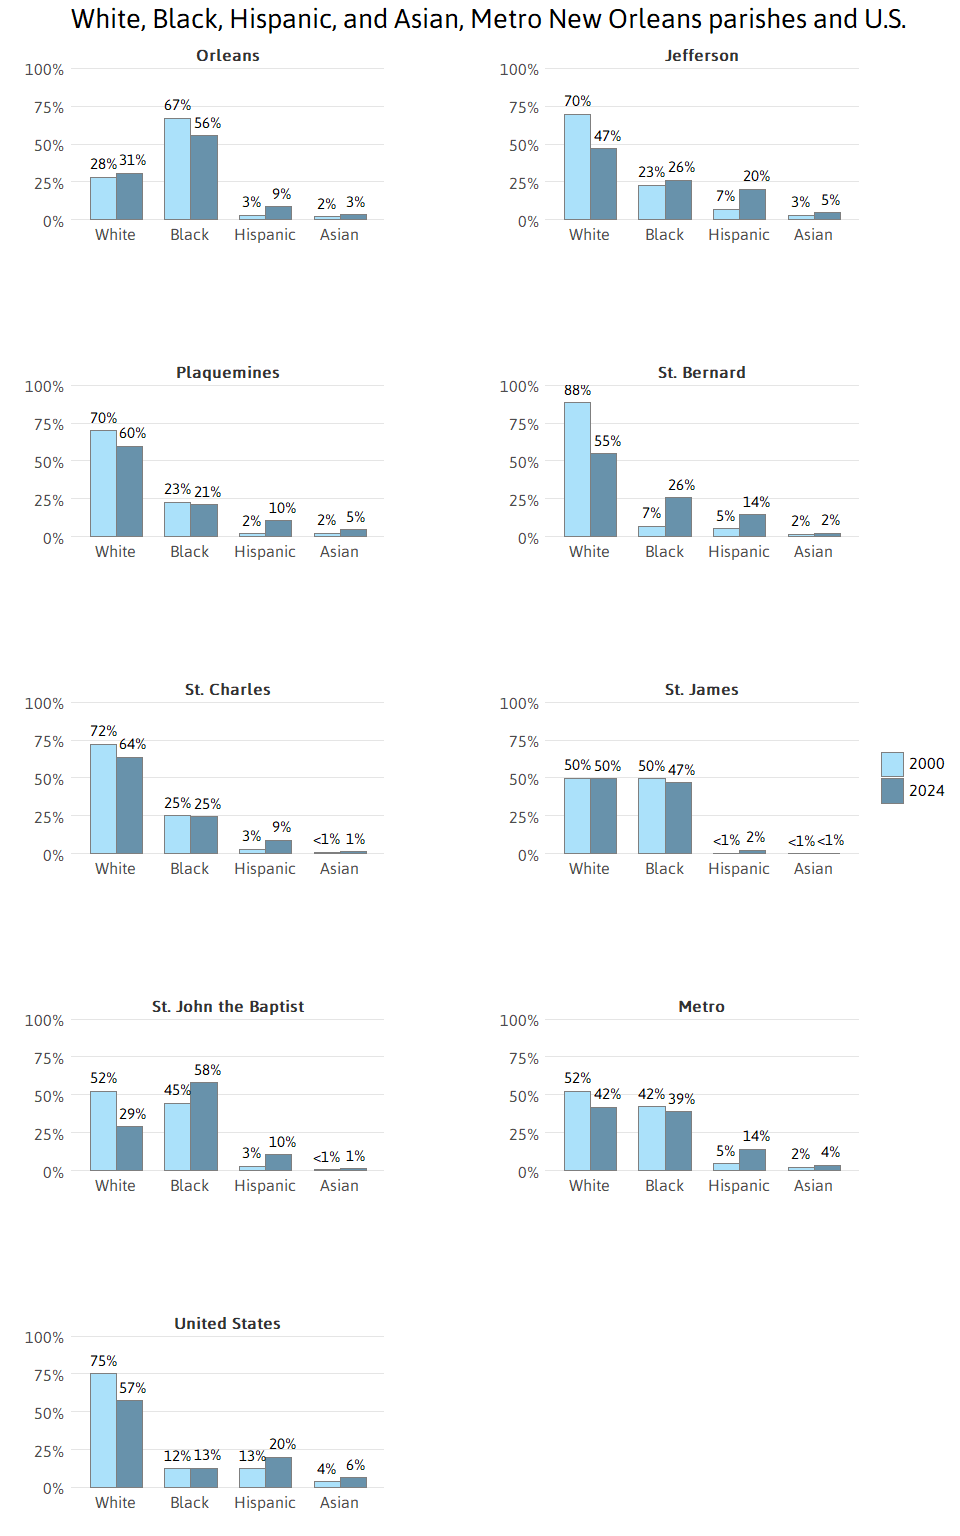
Source: The Data Center analysis of U.S. Census Bureau data from Census 2000 and Population Estimates 2024.
Between 2000 and 2024, the number of Hispanics in Jefferson Parish more than doubled — reaching 86,663 or more than 20 percent of the total parish population. In Orleans and St. Bernard parishes, the Hispanic population nearly doubled — growing to 31,213 (9 percent of the population) in Orleans and 6,421 (14 percent of the population) in St. Bernard. The number of Hispanics in St. Charles, St. John the Baptist, Plaquemines, and St. James more than doubled reaching 4,417, 4,074, 2,322, and 407 respectively.
As of July 2024, there were 135,517 Hispanics in the metro area, representing 14 percent of the metro population. This is up from 2000 when there were 53,947 Hispanics, representing 5 percent of the metro population. Despite these recent gains, the Hispanic share of the population in metro area parishes is below the average for the United States, which has grown from 13 percent to 20 percent of the total U.S. population over these 24 years.
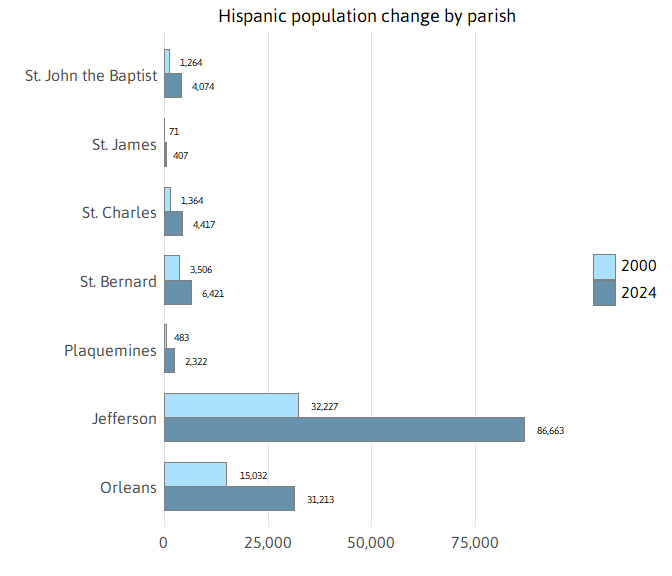
Source: The Data Center analysis of U.S. Census Bureau data from Census 2000 and Population Estimates 2024.
The number of Hispanics in the New Orleans metro has continued to swell in recent years. From 2010 to 2020, the Hispanic population accounted for the vast majority of the metro area’s growth, increasing by 44,154, while the overall population increased by only 51,149. Since 2020, the overall metro population declined but the Hispanic population continued to grow. From 2020 to 2024, the metro area gained another 10,155 Hispanic residents while losing a net total of 41,045 residents.
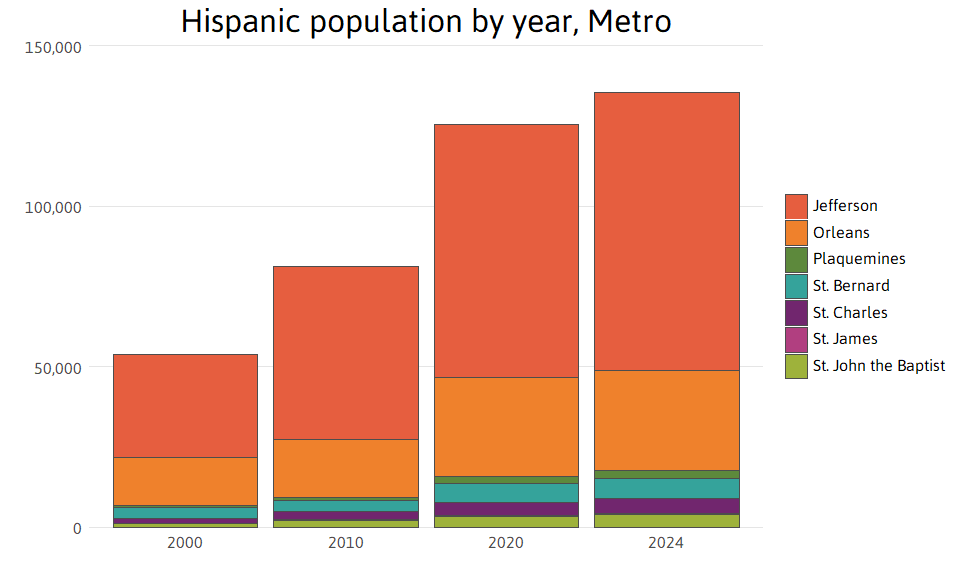
Source: The Data Center analysis of U.S. Census Bureau data from Census 2000, 2010, and Population Estimates 2020 and 2024.
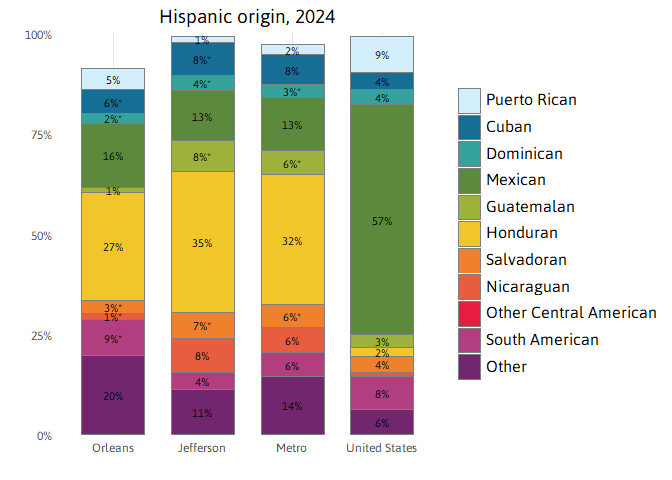
Hispanic is an umbrella term comprising multiple nationalities and ethnicities. Researchers have shown that most Hispanics prefer to identify by nationality rather than by pan-ethnic terms such as “Hispanic” and “Latino.”3 The nationalities of Hispanics residing in Metro New Orleans are quite distinct from the national Hispanic profile.
In 2024, the largest Hispanic group in Metro New Orleans was Honduran, representing 32 percent of the Hispanic population. In comparison, Hondurans represent only 2 percent of the national Hispanic population. These figures point to Metro New Orleans as a hub of Honduran migration.
Not to be ignored, the Mexican population represents 13 percent of the Hispanic population in Metro New Orleans. Nevertheless, the Mexican population is much less prominent in the metro than nationally, where it represents 57 percent of the Hispanic population.
∗ = Difference between indicated measure and the U.S. is not significant at 95% confidence interval.
Source: The Data Center analysis of U.S. Census Bureau data from American Community Survey 2024.
Population by age and household types
The progression of the baby boomers through the age groups, along with falling birth rates, has brought massive changes to the metro — and indeed the whole country — with many more changes yet to come.4 Looking at the total population in the metro by five-year age groups for 2000 and 2024, the baby boomers are like a demographic tidal wave. According to the American Community Survey, the median age of the metro has risen to 39.8 in 2024 from 34.8 in 2000.
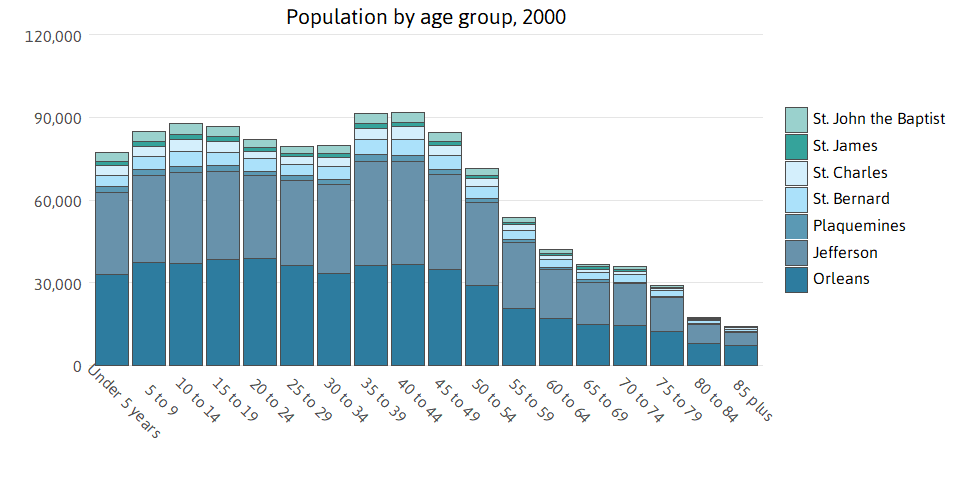
Source: The Data Center analysis of U.S. Census Bureau data from Census 2000.
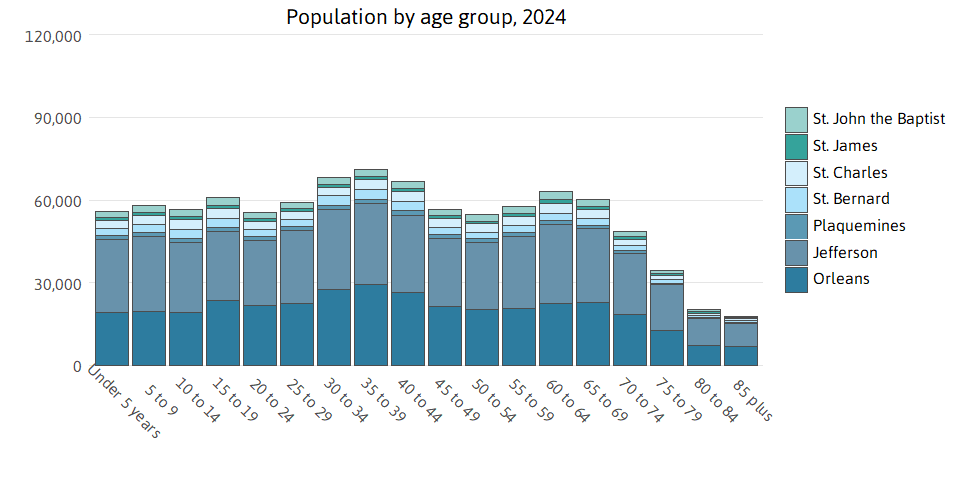
Source: The Data Center analysis of U.S. Census Bureau data from Population Estimates 2024.
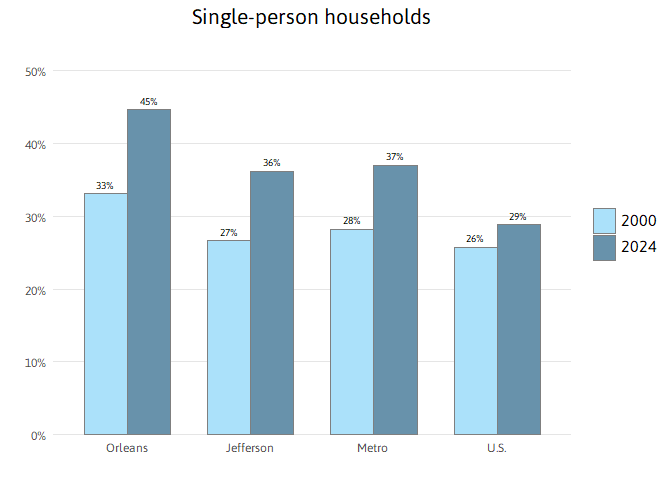
Meanwhile, the share of households with children is shrinking while the share of individuals living alone is growing — both across the metro and nation. As of 2024, 22 percent of households in Metro New Orleans included children, down from 33 percent in 2000. Between 2000 and 2024, the percent of Jefferson households with children declined from 33 percent to 21 percent; and the percent of Orleans households with children declined from 30 percent to 19 percent.
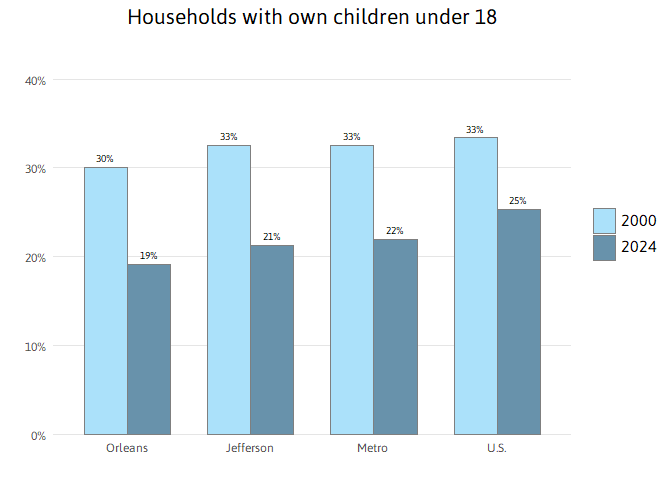
Source: The Data Center analysis of U.S. Census Bureau data from Census 2000 SF3 and American Community Survey 2024.
As households with children have declined, the share of single-person households has grown in the metro and nationwide. The metro area share of individuals living alone grew from 28 percent in 2000 to 37 percent in 2024 — similar to the trend for Jefferson Parish where the share of householders living alone grew from 27 percent to 36 percent. The increase was larger in Orleans Parish, which jumped from 33 to 45 percent.
Source: The Data Center analysis of U.S. Census Bureau data from Census 2000 SF3 and American Community Survey 2024.
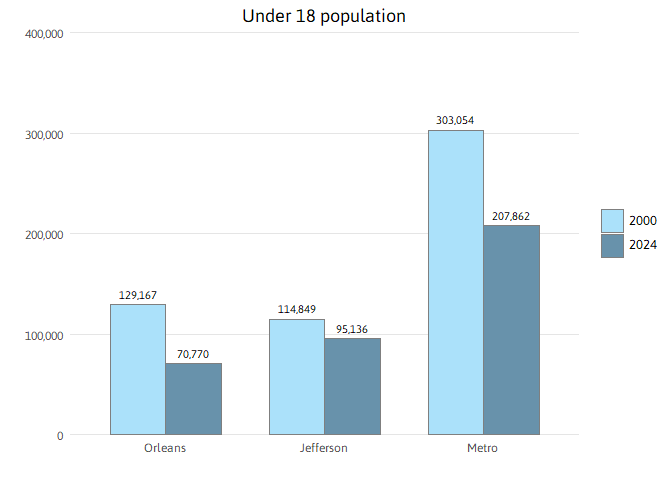
Overall, the youth population is substantially lower than pre-Katrina levels. The metro had 303,054 children under 18 years in 2000 and only 207,862 in 2024. More than half of this loss was driven by Orleans Parish, where the population under 18 has declined to 70,770 from 129,167. Jefferson Parish’s child population also declined from 114,849 to 95,136. The under 18 population is now 22 percent of the metro population, down from 26 percent in 2000.
Source: The Data Center analysis of U.S. Census Bureau data from Census 2000 and Population Estimates 2024.
Where is data for Plaquemines, St. Bernard, St. James, St. Charles, and St. John the Baptist?
Although race/ethnicity and age data is available for all seven parishes in Metro New Orleans, most other demographic data (such as educational attainment, poverty, and homeownership) is available for only the two most populous parishes of Jefferson and Orleans, as well as the metro.
Educational attainment, income, and employment
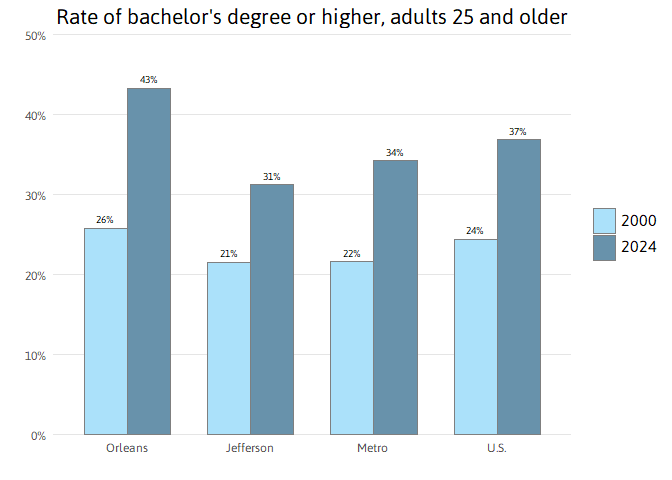
Educational attainment is an important determinant of household incomes, workforce skills, and regional resiliency.5 In New Orleans, 43 percent of adults 25 and older had at least a bachelor’s degree in 2024 — higher than the U.S. average of 37 percent, and up from 26 percent in 2000. The Jefferson Parish share of adults with a bachelor’s degree is 31 percent up from 21 percent in 2000. Overall, the share of adults with a bachelor’s degree in Metro New Orleans from 22 to 34 percent — just short of the national average of 37 percent.
Source: The Data Center analysis of U.S. Census Bureau data from Census 2000 SF3 and American Community Survey 2024.
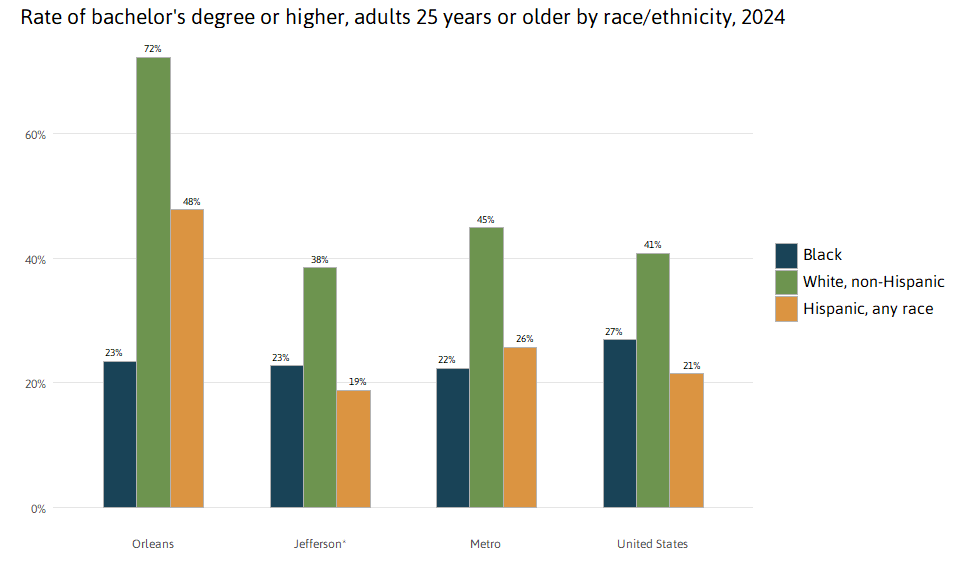
The share of New Orleans adults who have a bachelor’s degree has grown across racial and ethnic groups since 1980. But while 72 percent of White adults in New Orleans have a bachelor’s, only 48 percent of Hispanic adults, and 23 percent of Black adults in New Orleans have a bachelor’s as of 2024.

Notes: The number of Asians in New Orleans during the timespan of this chart is too small to produce reliable statistics. 1980 data for White educational attainment is inclusive of Hispanic people (due to data source limitations).
∗ = Change in time is not significant for Hispanic for 2000-2010.
Source: The Data Center analysis of U.S. Census Bureau data from 1980, 1990, 2000 SF3, and 2010 and American Community Survey 2024.
Notes: Due to high margins of error, data for Asians is not included in this chart.
∗ = In Jefferson Parish, the difference between Black and Hispanic is not statistically significant.
Source: The Data Center analysis of U.S. Census Bureau data from American Community Survey 2024.
The metro area increase in the share of adults with a bachelor’s degree or higher has been coupled with a decline in the share of adults with less than a high school degree. The proportion of adults 25 years and older with less than a high school education declined across Orleans, Jefferson, and the metro as a whole. The metro share of adults without a high school degree fell from 23 percent in 2000 to 12 percent in 2024. In Jefferson Parish, 14 percent of adults 25 and older have less than a high school degree while in New Orleans only 9 percent of adults have less than a high school degree — lower than the national average.
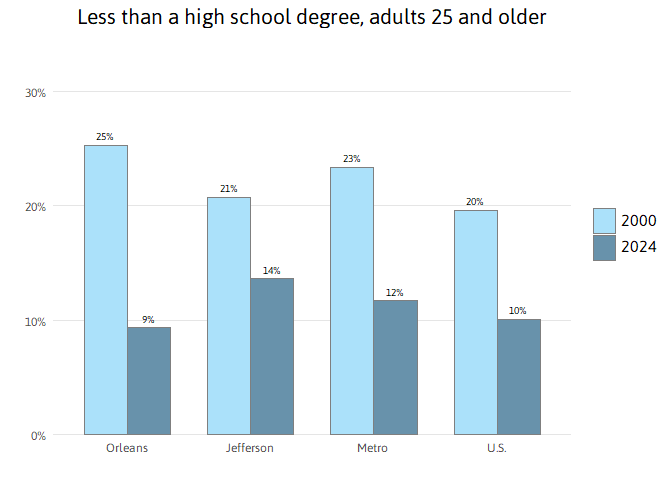
Source: The Data Center analysis of U.S. Census Bureau data from Census 2000 SF3 and American Community Survey 2024.
The 2024 median household income in Orleans Parish is $58,821 — 13 percent higher than in 2000 after controlling for inflation. Meanwhile, the median household income in Jefferson Parish, at $63,397 is 12 percent lower than in 2000 after controlling for inflation. The 2024 Metro New Orleans median household income of $62,373, $63,397 for Jefferson Parish, and $58,821 for the city of New Orleans are significantly lower than the U.S. median of $81,604.
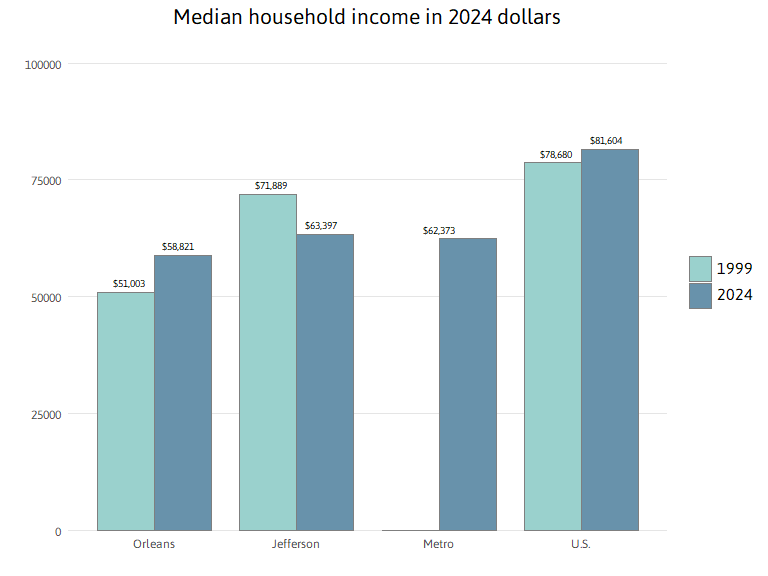
Notes: 1999 data is not available for Metro New Orleans.
Source: The Data Center analysis of U.S. Census Bureau data from Census 2000 SF3 and American Community Survey 2024.
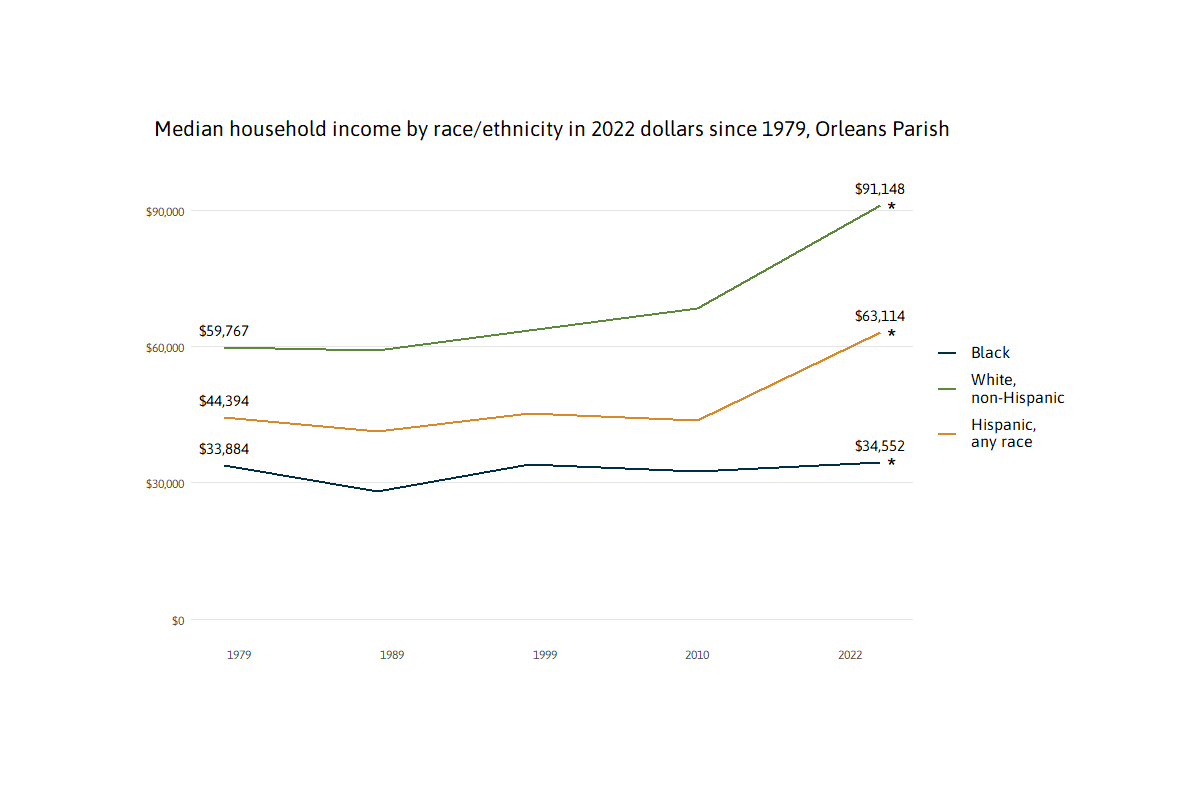
In 1979, households with higher incomes were disproportionately in the parishes surrounding New Orleans, while lower income White, Hispanic, and Black households were more likely to live in the city.6 By 2024, these patterns had changed with higher income White households more often living in the city, such that income disparity within the city has escalated. In 2024, Black households in New Orleans had a median income of only $40,285, while Hispanic households were at $63,594, and White households at $90,322.
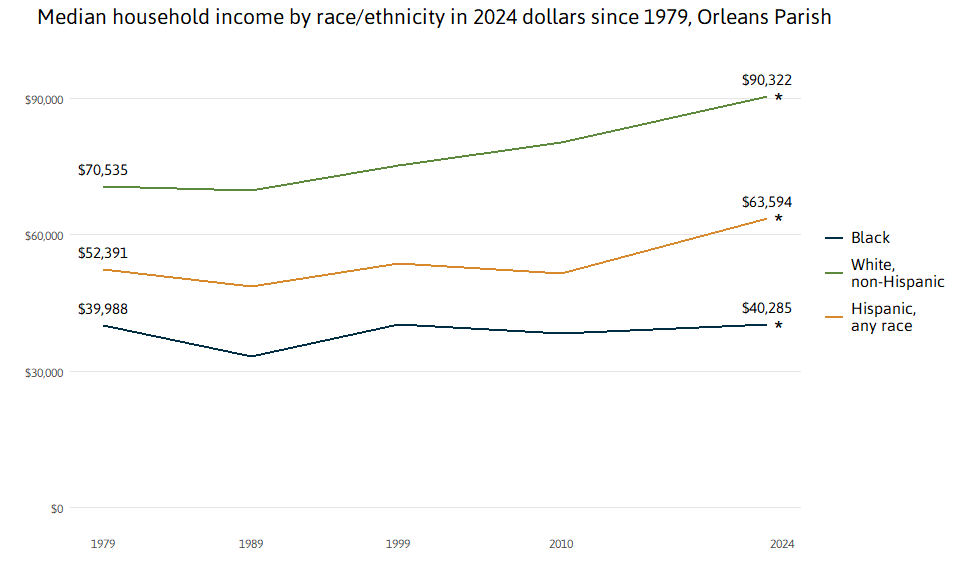
Notes: The number of Asians in New Orleans during the timespan of this chart is too small to produce reliable statistics.
∗ = Change in time is not significant for Black or Hispanic.
∗ = Change in time is not significant for any race for 1999-2010.
Source: The Data Center analysis of U.S. Census Bureau data from 1980, 1990, 2000 SF3, and 2010 and American Community Survey 2024.
In 2024, Black households in New Orleans have incomes 55 percent less than White households. In Jefferson, Black households have a median income of $44,679 which is 45 percent less than White households in that parish who have a median income of $81,222. Notably, Black households across the metro have a median income of $42,391, which is well below their national peers ($56,706).
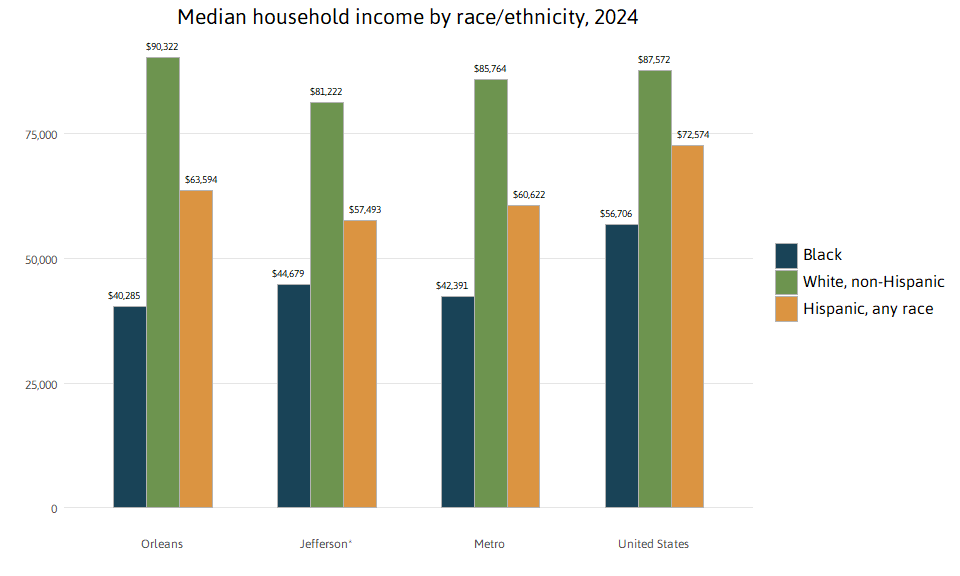
Notes: Due to high margins of error, data for Asians is not included in this chart.
∗ = In Jefferson Parish, the difference between Black and Hispanic is not statistically significant.
Source: The Data Center analysis of U.S. Census Bureau data from American Community Survey 2024.
Employment rates indicate the percent of the working age population that did any work for pay, including self-employment. Employment rates are a more comprehensive measure of labor market conditions than official “unemployment” rates, because they not only reveal the share of the population that are unemployed but also those who are no longer in the labor force at all — many of whom are “discouraged workers.”7 Employment rates by race and gender suggest the extent to which structural economic changes have benefited different groups. In New Orleans, employment rates have risen for White men and women, Hispanic men and women, and Black women compared with 1980, but for Black men are lower in 2024 at 58 percent than in 1980 when 63 percent of working age Black men had employment.
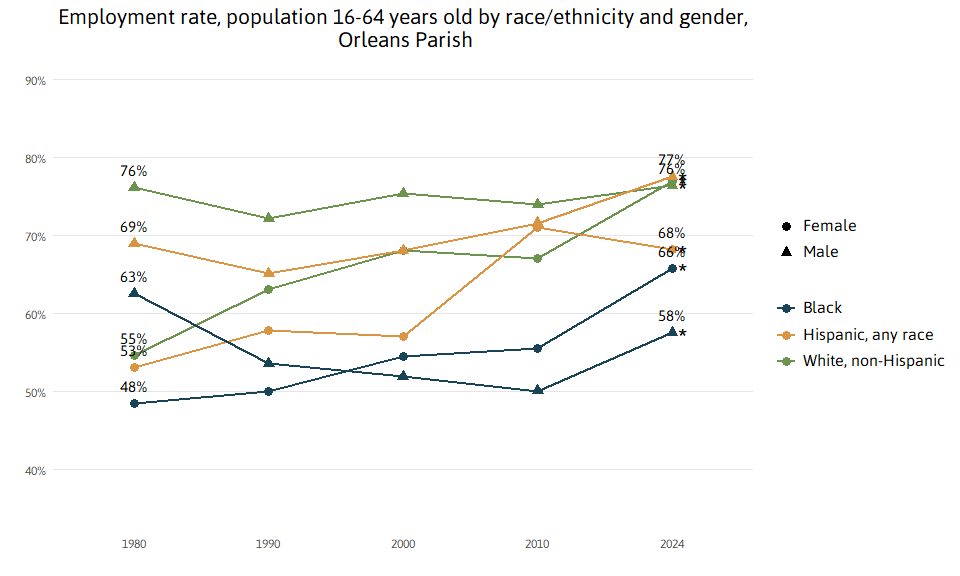
∗ = Change in time is not significant over time for White males since 2000.
∗ = Change in time is not significant for White males and females, Black males and females, and Hispanic males for 2000-2010.
∗ = Change in time is not significant for Black males for 2000-2024.
∗ = Change in time is not significant for Hispanic males and females for 2010-2024.
Source: The Data Center analysis of U.S. Census Bureau data from American Community Survey 2024.
In 2024 New Orleans, White men (at 76 percent) are more likely to have employment than their national peers, while Black men and women in New Orleans (at 58 and 66 percent respectively) are less likely to have employment than their national peers. The rates of employment for White women, Hispanic men and women are not statistically different than their national peers.
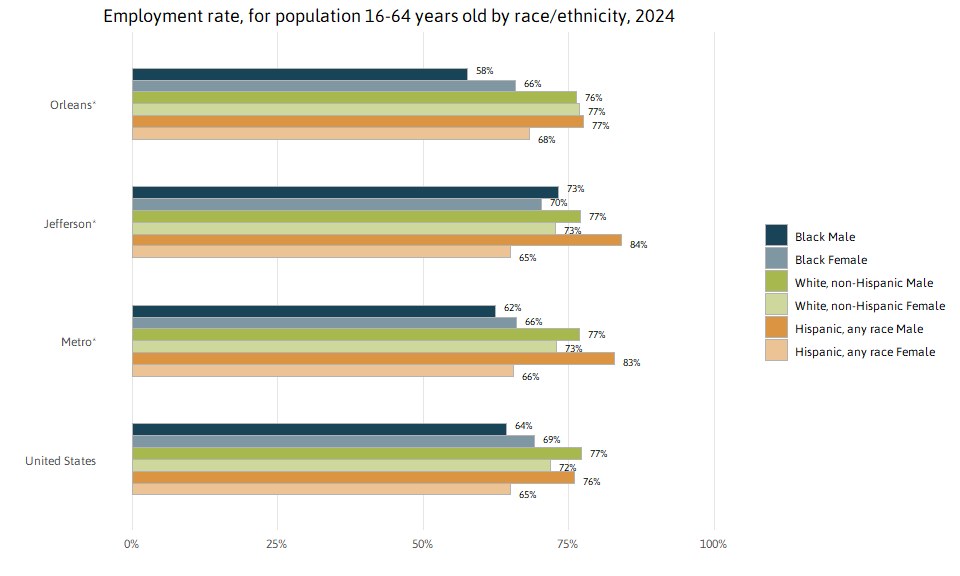
Notes: Due to high margins of error, data for Asians is not included in this chart.
∗ = In Orleans Parish, the difference between White and Hispanic males, White and Hispanic females, and Black and Hispanic females is not significant.
∗ = In Jefferson Parish, the difference between White and Black males, White and Black females, and Black and Hispanic females is not significant.
∗ = In Metro New Orleans, the difference between Black and Hispanic females is not significant.
Source: The Data Center analysis of U.S. Census Bureau data from American Community Survey 2024.
Poverty and access to vehicles and internet
A high share of residents living below the poverty level indicates the economy is not providing many residents with the ability to meet their most basic needs, including food, housing, and transportation. The poverty rate in New Orleans decreased from 28 to 21 percent between 1999 and 2024, while the Jefferson Parish poverty rate increased from 14 to 17 percent. Across the U.S., the poverty rate hovers around 12 percent.
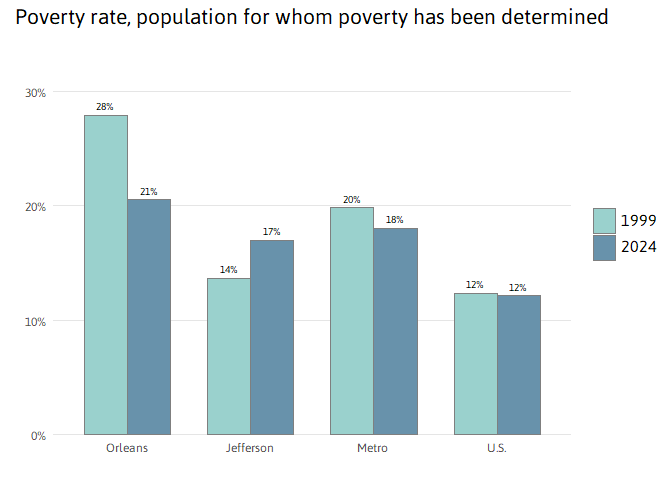
Source: The Data Center analysis of U.S. Census Bureau data from Census 2000 SF3 and American Community Survey 2024.
How is poverty measured?
The Census still uses the federal definition for poverty that was first created in 1964. The original calculations were based on studies from the early 1960s that indicated that family food costs were about one-third of a family’s budget. But housing costs have risen much faster than food costs since 1964. Also, the current calculations don’t count non-cash government aid, like Child Tax Credits or housing subsidies, as income. And they aren’t adjusted for differences in costs of living in different parts of the country. Given these limitations, the Census began publishing a Supplemental Poverty Measure that incorporates up-to-date data on regional housing costs as well as several kinds of government aid. According to the Census, the 2024 Supplemental Poverty Rate for the U.S. was 12.9 percent. The Official Poverty Rate that same year was 10.6 percent.8 The Census Bureau does not calculate Supplemental Poverty Rates for geographies smaller than the nation as a whole.9
The poverty rate for Black New Orleanians spiked when the 1980s “oil bust” hit, jumping from 37 percent in 1979 to 42 percent in 1989. White New Orleanians were not similarly affected. The poverty rate for White New Orleanians remained at roughly 12 percent in 1979 and in 1989. In 2024, the poverty rate for White New Orleanians was 9 percent, while the poverty rate for Black New Orleanians had fallen to 26 percent but remained about triple that of White New Orleanians.
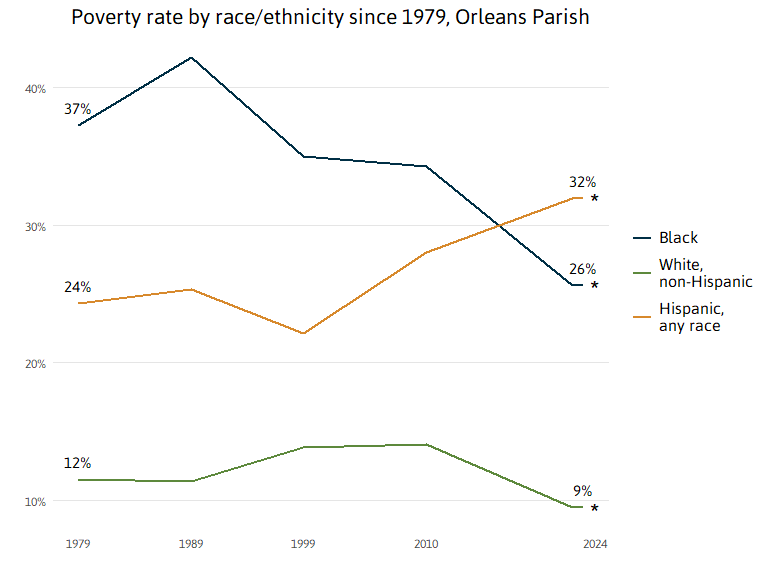
Notes: The number of Asians in New Orleans during the timespan of this chart is too small to produce reliable statistics. 1980 data for White poverty rates is inclusive of Hispanic people (due to data source limitations).
∗ = Change in time is not significant for any race for 1999-2010.
∗ = Change in time is not significant for Hispanic 2010-2024.
Source: The Data Center analysis of U.S. Census Bureau data from 1980, 1990, 2000 SF3, and 2010 and American Community Survey 2024.
Large disparities in the poverty rate continue to be evident at all geographic levels. For example, in Metro New Orleans 26 percent of Black people and 25 percent of Hispanic people live in poverty compared to 9 percent of White people.
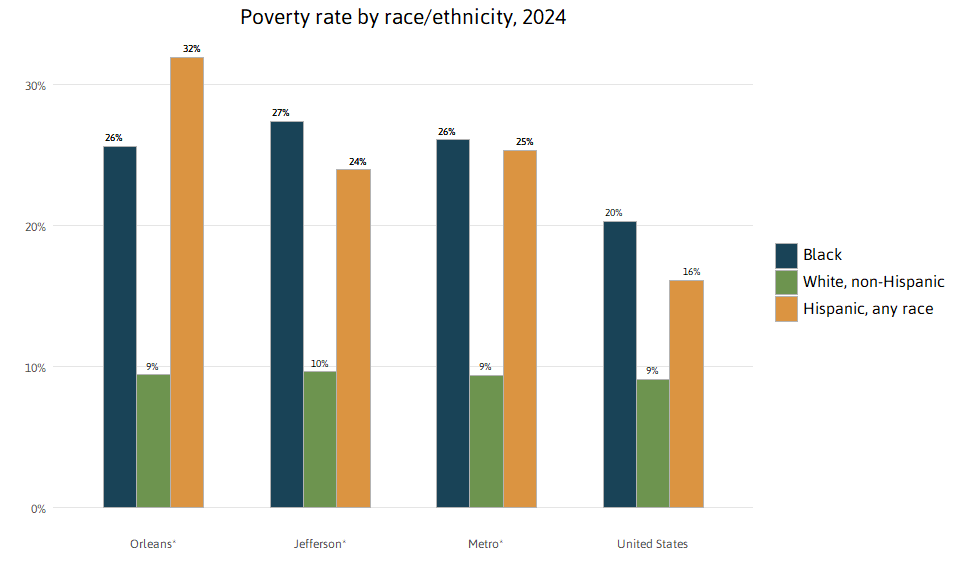
Notes: Due to high margins of error, data for Asians is not included in this chart.
∗ = In Orleans Parish, the difference between Black and Hispanic is not statistically significant.
∗ = In Jefferson Parish, the difference between Black and Hispanic is not statistically significant.
∗ = In the New Orleans Metro Area, the difference between Black and Hispanic is not statistically significant.
Source: The Data Center analysis of U.S. Census Bureau data from American Community Survey 2024.
Like the overall poverty rate, the child poverty rate in New Orleans decreased from 41 percent 1999 to 29 percent in 2024. In Jefferson, 26 percent of children live in poverty and across the metro 26 percent, both higher than the national rate.
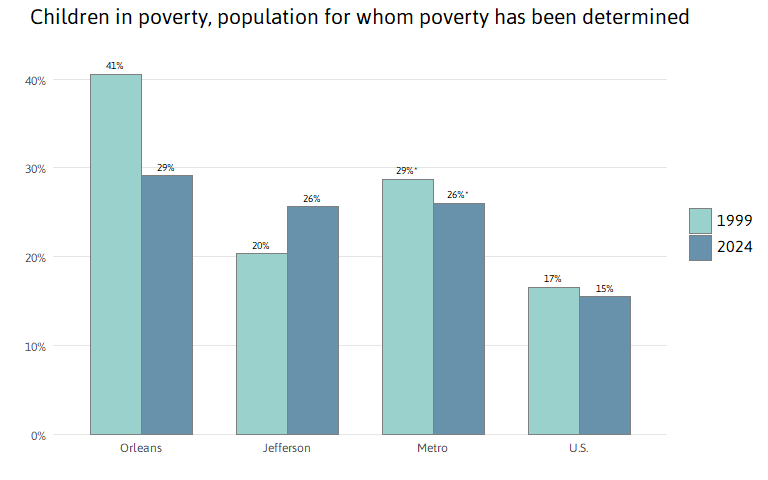
∗ = Difference between 1999 and 2024 is not significant at 95% confidence interval.
Source: The Data Center analysis of U.S. Census Bureau data from Census 2000 SF3 and American Community Survey 2024.
In Orleans Parish, 36 percent of Black children live in poverty while 3 percent of White children are poor. In New Orleans, child poverty rates peaked in 1989 for Black children and have fallen, but at 36 percent are still 10 times higher than poverty rate for White children in New Orleans. The poverty rate for White children has declined from about 1 in 10 children in poverty in 1979 to about 1 in 50 in 2024.
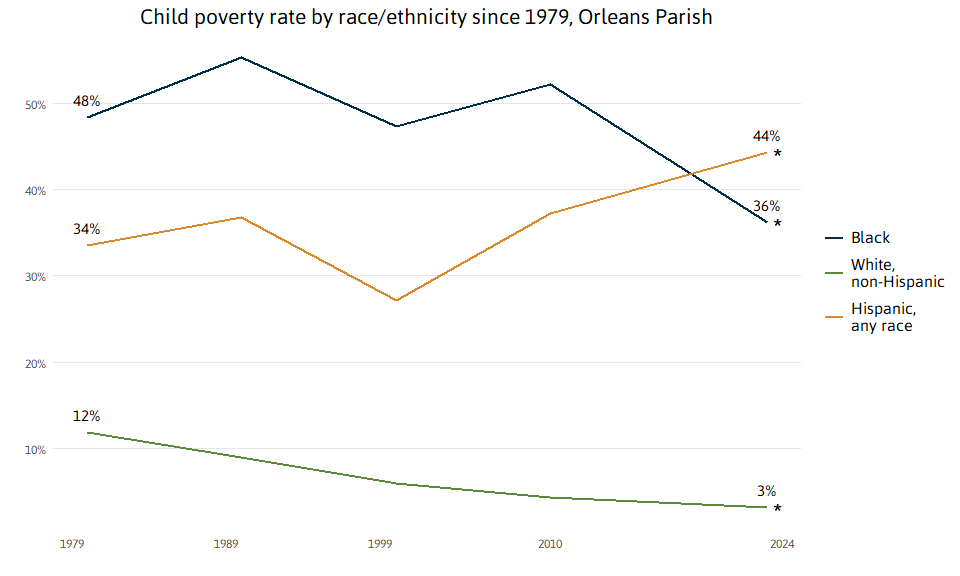
Notes: The number of Asians in New Orleans during the timespan of this chart is too small to produce reliable statistics. 1980 data for White child poverty is inclusive of Hispanic people (due to data source limitations).
∗ = Change in time is not significant for any race for 1999-2024 or 2010-2024.
∗ = Change in time is not significant for Hispanic for 1999-2010.
∗ = Change in time is not significant for White since 1999.
Source: The Data Center analysis of U.S. Census Bureau data from 1980, 1990, 2000 SF3, and 2010 and American Community Survey 2024.
While in Orleans, poverty rates for Black children are 10 times higher than for White children, in Jefferson Parish Black children experience poverty about four times higher rates than White children. In Metro New Orleans, 31 percent of Hispanic children live in poverty — higher than their national peers of whom 21 percent live in poverty.
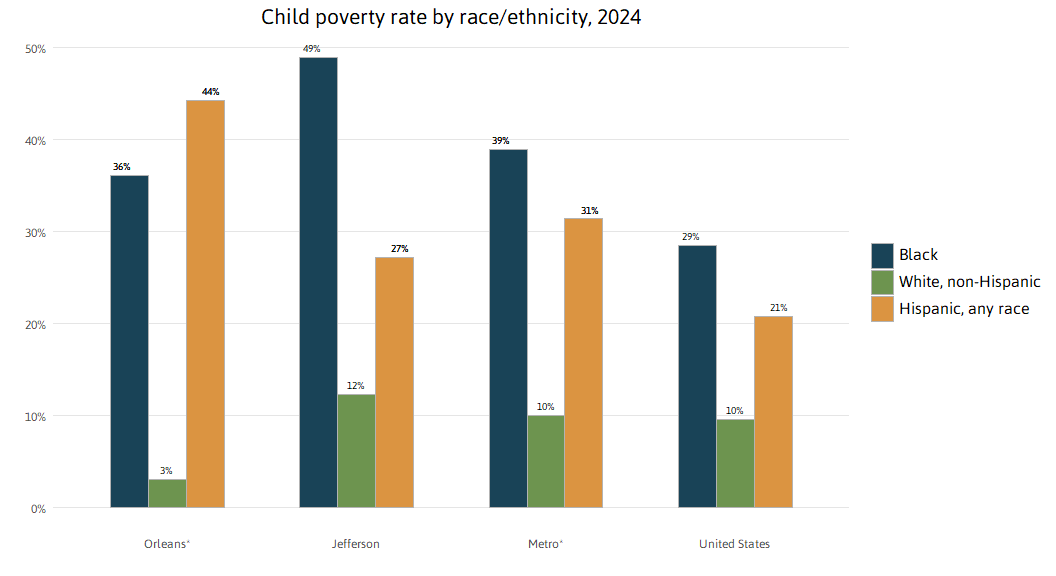
Notes: Due to high margins of error, data for Asians is not included in this chart.
∗ = In Orleans Parish, the difference between Black and Hispanic is not statistically significant.
∗ = In the New Orleans Metro Area, the difference between Black and Hispanic is not statistically significant.
Source: The Data Center analysis of U.S. Census Bureau data from Census 2000 SF3 and American Community Survey 2024.
Post-Katrina, the share of New Orleans households without access to a vehicle dropped from 27 percent in 2000 to 17 percent in 2024. Nonetheless, at 17 percent, New Orleans’ share is higher than the metro overall, indicating the importance of a robust public transportation system and comprehensive evacuation plan.
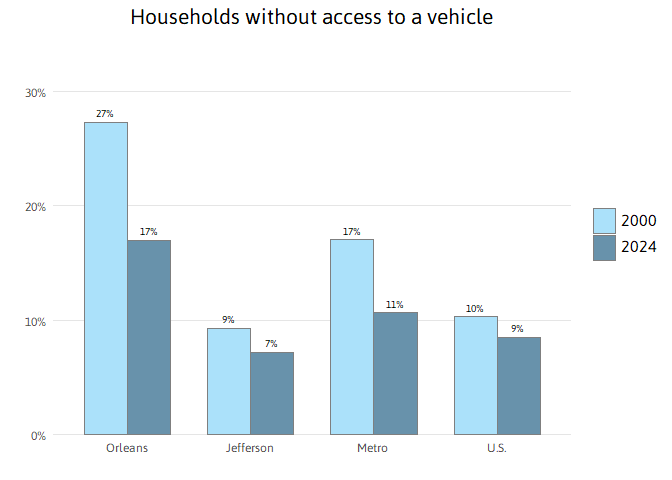
Source: The Data Center analysis of U.S. Census Bureau data from Census 2000 SF3 and American Community Survey 2024.
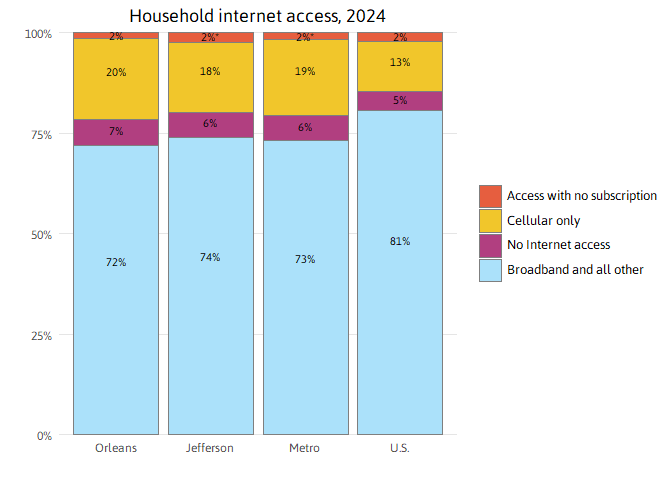
Internet access is an important indicator of access to information. Studies have shown that without broadband, computer access, and encompassing technology training services, workers and students are at a disadvantage in the job market and education system.8 Only 72 percent of households in Orleans Parish and only 74 percent of households in Jefferson Parish are connected to the internet through a home-based internet service, such as broadband (cable, DSL, or fiber), satellite, or dial-up service, compared to 81 percent nationwide. Internet access without a subscription refers to households that only have access through group access locations such as school, work, a library, or coffee shop.
An increasingly common way to access the internet is through a smartphone or some other cellular device. While, in general, smartphone access contributes positively to lessening the Digital Divide, having access only through a smartphone restricts ability to fully leverage the internet to complete common tasks such as writing and researching a resume, registering your kids for school, analyzing data about your neighborhood, or creating content for an internet business. In Orleans Parish, 20 percent of households only have access through a smartphone, compared to 13 percent nationwide.
What is the Digital Divide?
Inequalities between individuals, households, businesses, or geographic areas with regard to access, use of, or impact of information and communication technologies.
∗ = Difference between indicated measure and the U.S. is not significant at 95% confidence interval.
Notes: Access with no subscription refers to those who receive free internet from their housing environment (e.g. college dorms).
Source: The Data Center analysis of U.S. Census Bureau data from American Community Survey 2024.
Foreign-born population and geographic mobility
A rising foreign-born share of the population may reflect expanding economic opportunities for both high-skilled and low-skilled workers.9 That share of the population has grown in Orleans, Jefferson, and across the metro as whole since 2000, led by a 7.6 percentage point gain in Jefferson Parish. By 2024, fully 15.1 percent of Jefferson Parish population was foreign-born, similar to the U.S. share. In Orleans Parish the foreign-born share of the population increased by 2.2 percentage points between 2000 and 2024.
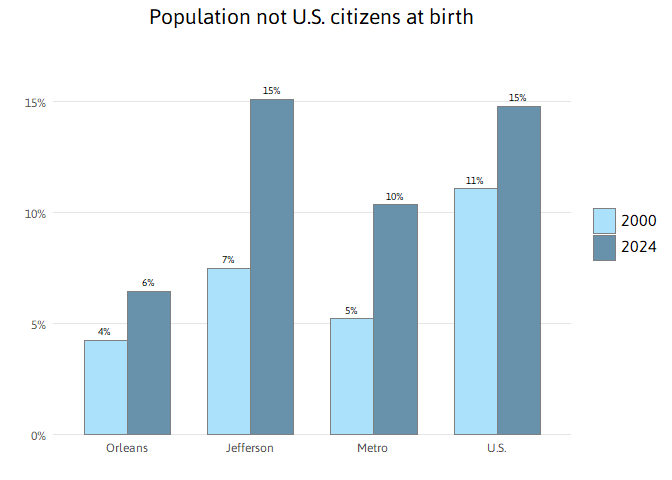
Source: The Data Center analysis of U.S. Census Bureau data from Census 2000 SF3 and American Community Survey 2024.
Like the foreign-born population, a rising share of the population who moved into Orleans Parish in the past year may reflect expanding economic opportunities. The most frequent reason people move long distances, such as from one state to another state, is for job opportunities.10 In addition, the young and well-educated are more likely than others to move long distances.11 In 2024, 7 percent of the population in Orleans Parish had moved into the parish in the past year, up from 3 percent in 2004. Over 52 percent of the new movers into Orleans Parish came from outside the state of Louisiana. In Jefferson Parish, the share of the population who were new movers into the parish was 5 percent in 2004 and has not significantly changed.
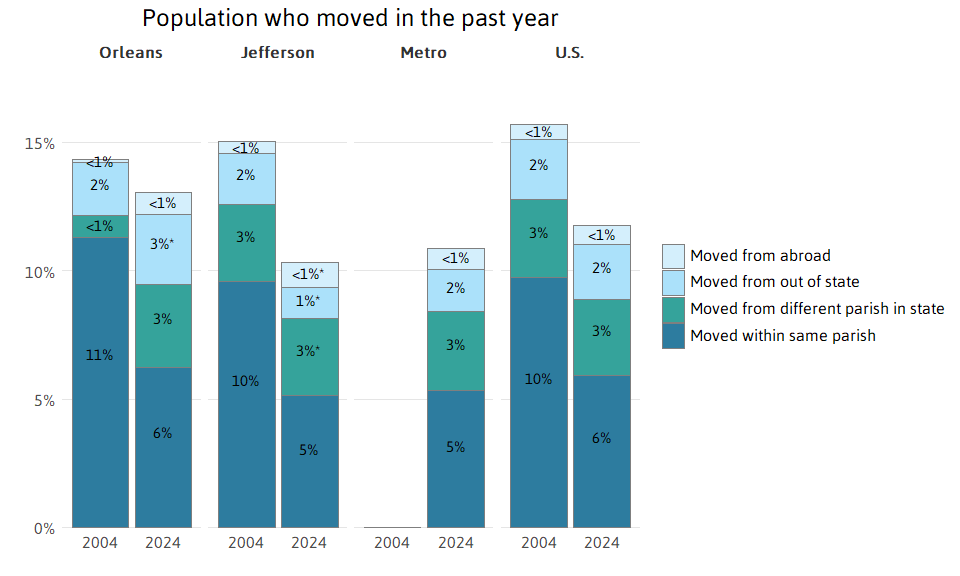
Notes: Share not included in the bar chart represents the population who lived in the same house one year ago (non-movers). For people living in the same house as a year ago, the difference between 2004 and 2024 is not significant at the 95% confidence interval for Orleans Parish. It is significant for all other geographies
Notes: 2004 data is not available for Metro New Orleans.
∗ = Difference between 2004 and 2024 is not significant at 95% confidence interval.
Source: The Data Center analysis of U.S. Census Bureau data from American Community Survey 2004 and 2024.
Homeownership
Homeownership rates across the U.S. have fallen since 2000 from 66 to 65 percent in 2024. Homeownership rates in New Orleans have increased from 46 percent in 2000 to 53 percent in 2024, but remain lower than the metro as a whole where 62 percent of households are homeowners.
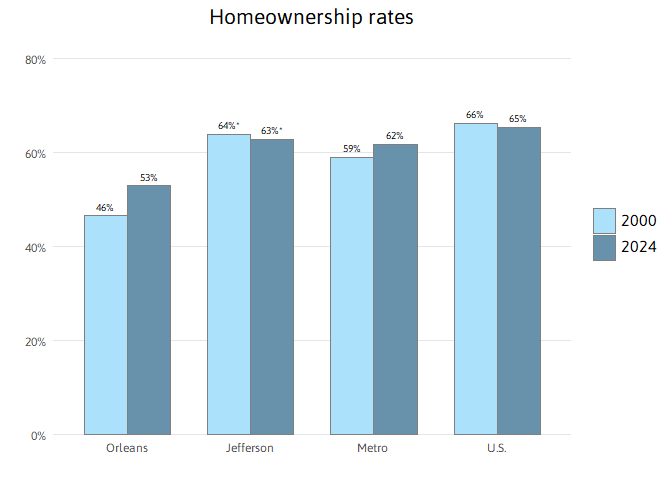
∗ = Difference between 2000 and 2024 is not significant at 95% confidence interval.
Source: The Data Center analysis of U.S. Census Bureau data from Census 2000 SF1 and American Community Survey 2024.
Homeownership rates among Black householders in New Orleans made consistent progress between 1970 and 2024, increasing from 27 percent to 48 percent. Still, the difference in homeownership rates between Black and White people in 2024 was significant, with only 48 percent of Black householders in New Orleans owning their homes compared to 60 percent of White householders.
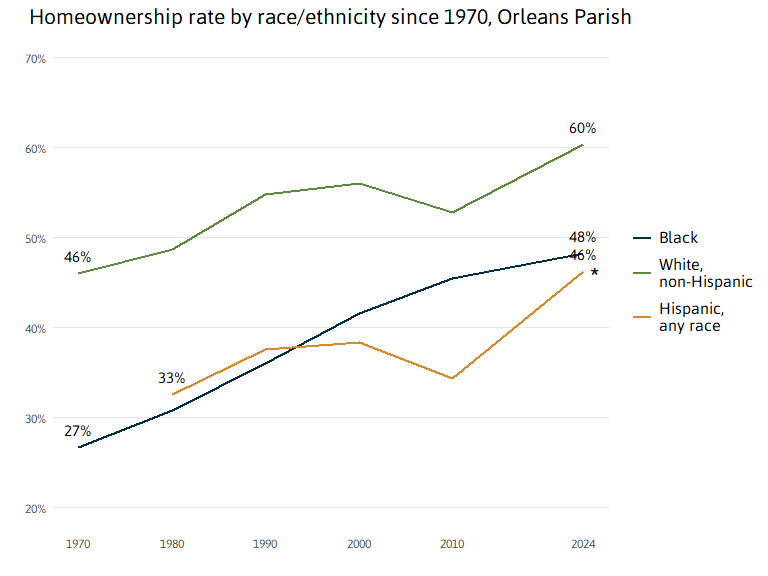
Notes: The number of Asians in New Orleans during the timespan of this chart is too small to produce reliable statistics. 1970 and 1980 data for White homeownership is inclusive of Hispanic people (due to data source limitations).
∗ = Change in time is not significant for Hispanic for 2000-2024.
Source: The Data Center analysis of U.S. Census Bureau data from 1980, 1990, 2000 SF1, and 2010 and American Community Survey 2024.
Metro homeownership rates roughly mirror national rates, with just over 62 percent of all householders owning their homes and White homeownership rates about 24 percentage points higher than rates for Black homeownership. This disparity is smaller in Orleans Parish, where only 60 percent of White householders own their homes — 12 percentage points higher than Black householders. Homeownership in Jefferson outstrips Orleans with 63 percent of all householders owning their home. But this is driven by a higher White homeownership rate of 75 percent which is 32 percentage points higher than for Black householders in Jefferson Parish.
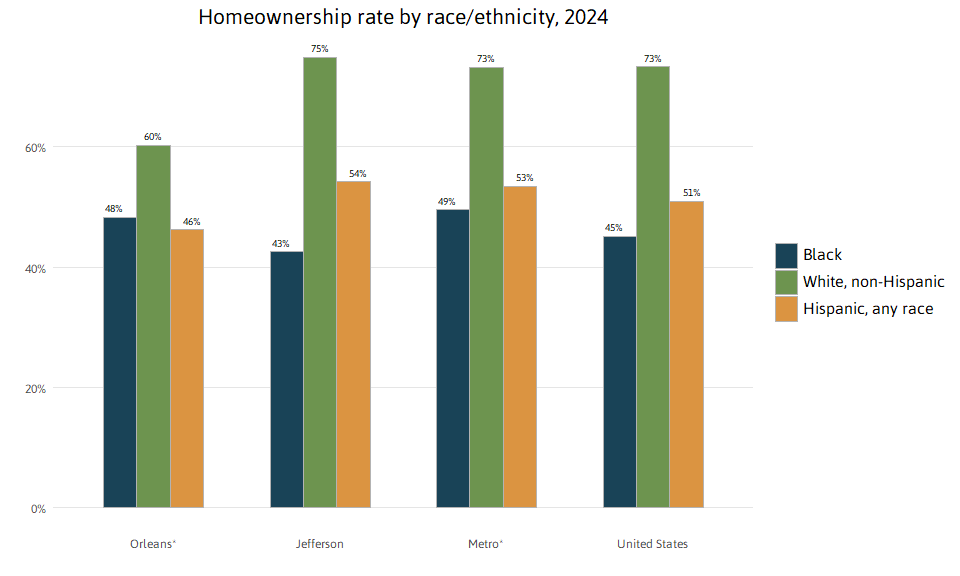
Notes: Due to high margins of error, data for Asians is not included in this chart.
∗ = In Orleans Parish, the difference between Black and Hispanic is not statistically significant.
∗ = In the New Orleans Metro Area, the difference between Black and Hispanic is not statistically significant.
Source: The Data Center analysis of U.S. Census Bureau data from American Community Survey 2024.
Homeowners without a mortgage own their homes free and clear of any type of loan. A high share of such homeowners usually indicates residents living in the same house for long periods of time and helps shield neighborhoods from foreclosures. The proportion of metro area homeowners without a mortgage has increased from 36 to 44 percent between 2000 and 2024, driven by changes in Orleans and Jefferson. The share of homeowners without a mortgage jumped from 33 to 43 percent in Orleans and from 35 to 46 percent in Jefferson.
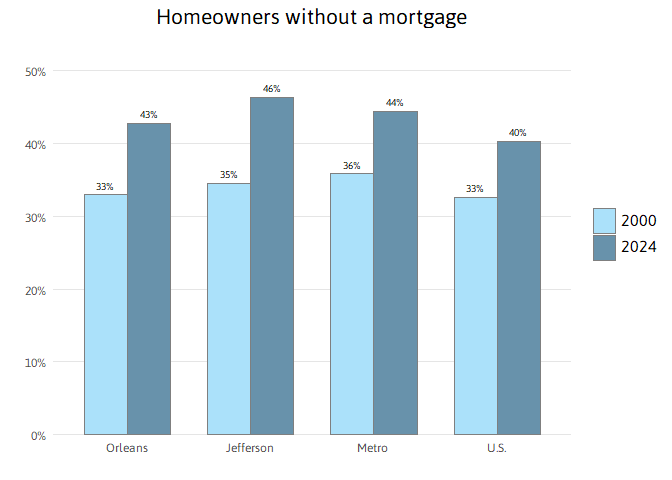
Source: The Data Center analysis of U.S. Census Bureau data from Census 2000 SF3 and American Community Survey 2024.
Housing costs and affordability, housing stock, and commuting
High housing costs can limit a region’s ability to attract and retain the workforce essential for a healthy economy.12 Severe housing cost burdens of more than 50 percent of household income indicate a serious problem in housing affordability. In 2004, the share of severely cost-burdened renters in New Orleans and the U.S. was 24 percent. In the 20 years since, that share has spiked to 33 percent in Orleans while growing to only 26 percent nationally. In Jefferson Parish, the share of renters paying more than 50 percent of household income on housing and utilities is 29 percent in 2024.
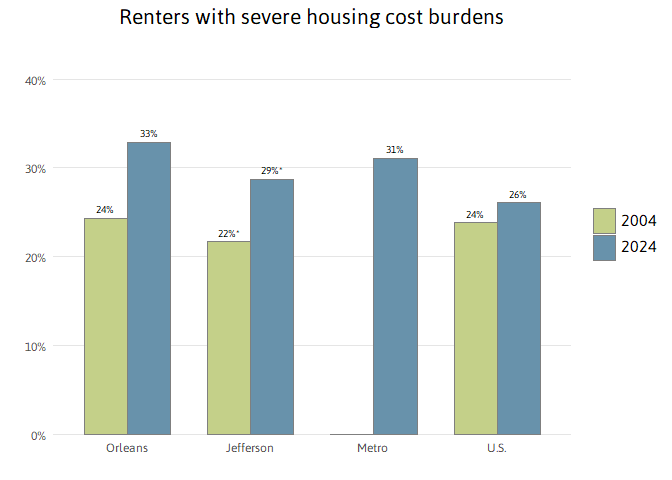
Notes: 2004 data is not available for Metro New Orleans.
Source: The Data Center analysis of U.S. Census Bureau data from American Community Survey 2004 and 2024.
The share of homeowners paying more than 50 percent of household income on their mortgage, taxes, utilities, and insurance is only 14 percent across the metro area. There is a clear gap between the rate of housing cost burden for renters vs. homeowners, and that gap has widened.
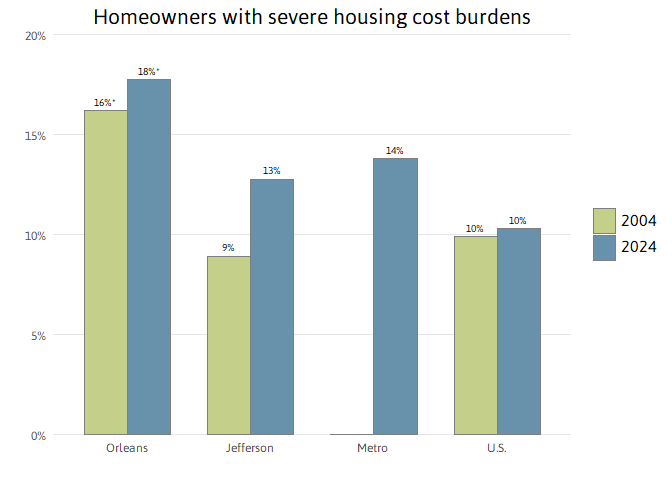
Notes: 2004 data is not available for Metro New Orleans.
∗ = Difference between 2004 and 2024 is not significant at 95% confidence interval.
Source: The Data Center analysis of U.S. Census Bureau data from American Community Survey 2004 and 2024.
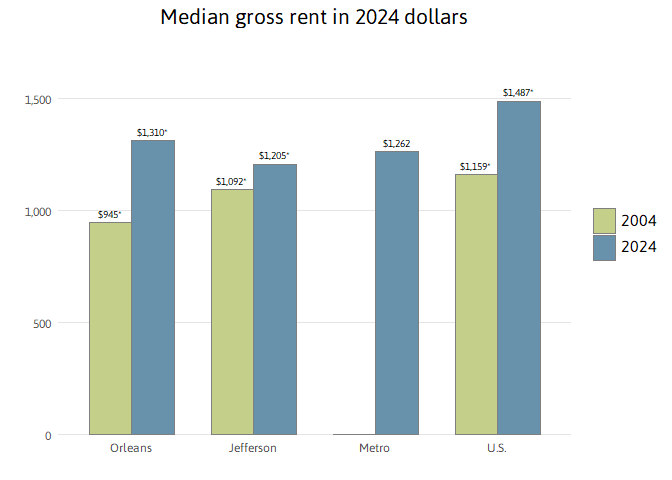
The surge in the share of severely cost-burdened renters in New Orleans is reflective of the surge in the median gross rent (rent plus utilities) in the city. From 2004 to 2024, monthly rent plus utilities rose from $945 to $1,310 in New Orleans, a 39 percent increase after adjusting for inflation. Meanwhile, median gross rents increased 28 percent nationwide.
Notes: 2004 data is not available for Metro New Orleans
∗ = Difference between 2004 and 2024 is not significant at 95% confidence interval.
Source: The Data Center analysis of U.S. Census Bureau data from American Community Survey 2004 and 2024.
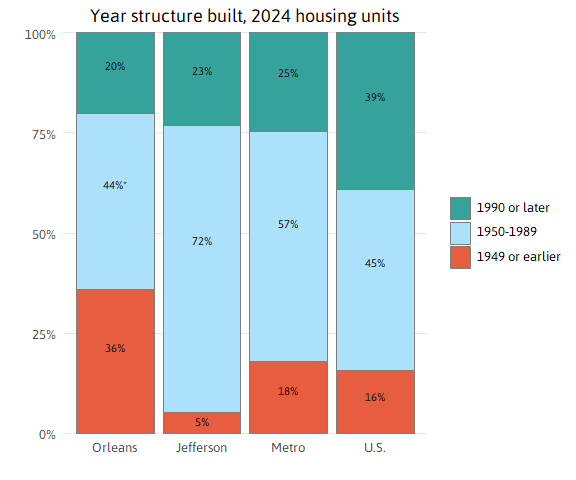
America’s aging housing stock represents both a potential problem and an opportunity. Older homes are less energy-efficient and more expensive to maintain.13 Moreover, research has shown that lead poisoning in children is correlated strongly with residing in pre-1950 homes.14 Conversely, in New Orleans, many older homes are protected by preservation laws that have helped retain the historic character of the city.
In Orleans Parish, fully 36 percent of all housing units are in pre-1950 structures. Meanwhile, in Jefferson Parish, 72 percent of the housing stock was built in the 1950s, 1960s, 1970s, and 1980s, and just 23 percent of housing stock has been built since 1990.
Source: The Data Center analysis of U.S. Census Bureau data from American Community Survey 2024.
A metro region is partially defined by the commuting patterns of its residents. Nationwide and across Metro New Orleans, there has been a sizable increase in people working from home since the COVID-19 pandemic struck. In New Orleans, the share working at home rose from 3 percent in 2000 to 13 percent in 2024, while the share using public transportation declined sharply from 14 percent in 2000 to 4 percent in 2024. Working from home is somewhat less common in Jefferson (7 percent) than in New Orleans or across the nation (13 percent).
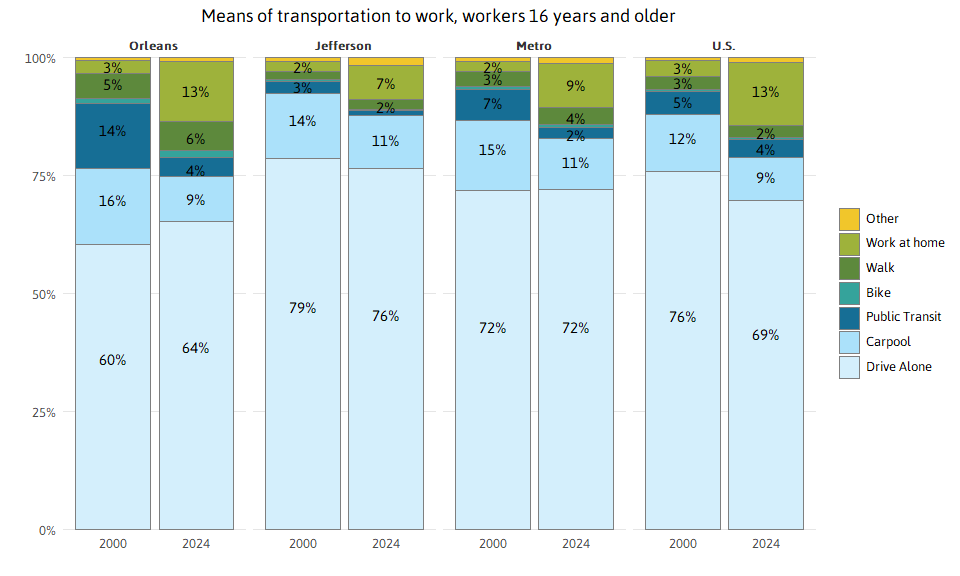
Source: The Data Center analysis of U.S. Census Bureau data from Census 2000 SF3 and American Community Survey 2024.
Data Sources / Methodology
Data on race/ethnicity and age is from the Census Bureau vintage 2024 population estimates and Census 2000 Summary File 1 (SF1). Other demographic data is from the Census 2000 Summary File 3 (SF3) and American Community Survey 2004, and 2024 (single-year files).
Statistical tests of significance were computed at the 95% confidence level for all data from the American Community Survey and Census 2000 SF3. An “*” indicates that differences between two time periods or geographies are not significant, and therefore are the result of sampling variability rather than real change in characteristics of the population.
The significance tests require both estimates and their standard errors. Standard errors for the ACS estimates were calculated using formulas from section seven, “Understanding Error and Determining Statistical Significance” available at: https://www.census.gov/content/dam/Census/library/publications/2018/acs/acs_general_handbook_2018.pdf.
Standard errors for Census 2000 SF3 data were calculated using formulas from Chapter 8 of the Technical Documentation available at: https://www2.census.gov/programs-surveys/decennial/2000/technical-documentation/complete-tech-docs/summary-files/sf3.pdf.
Standard errors for Census 2000 and Census 2010 SF1 data are zero.
Endnotes
-
The eight-parish New Orleans metro includes Jefferson, Orleans, Plaquemines, St. Bernard, St. Charles, St. James, St. John the Baptist, and St. Tammany. From 2003-2012, the New Orleans metro was comprised of seven parishes, excluding St. James. In 2023, the official definition of the New Orleans metro area changed to exclude St. Tammany. ↩
-
Throughout this brief, when referring to Population Estimates and Projections data, “Black,” “Asian,” and “White” refer to individuals who report to be only one race and not Hispanic. However, “Hispanics” can be of any race(s). When using American Community Survey data, “Black” and “Asian” are inclusive of “Hispanics”. ↩
-
Taylor, P., Lopez M. H., Martinez, J., and Velasco, G. (2014). When Labels Don’t Fit: Hispanics and Their Views of Identity. Retrieved October 3, 2014 from http://www.pewhispanic.org/2012/04/04/when-labels-dont-fit-hispanics-and-their-views-of-identity. ↩
-
Plyer, A. and Ortiz, E. (2011). Drivers of housing demand: Preparing for the impending elder boom. Retrieved July 8, 2013 from http://www.datacenterresearch.org/reports_analysis/drivers-of-housing-demand. ↩
-
Plyer, A. and Ortiz, E. (2011). Drivers of housing demand: Preparing for the impending elder boom. Retrieved July 8, 2013 from http://www.datacenterresearch.org/reports_analysis/drivers-of-housing-demand. ↩
-
Julian, T. and Kominski, R. (2011). Education and synthetic work-life earnings estimates. Retrieved February 8, 2023 from https://www.census.gov/library/publications/2011/acs/acs-14.html; U.S. Department of Housing and Urban Development. (2012). Conceptualizing and measuring resilience. Retrieved September 18, 2012 from http://www.huduser.org/portal/periodicals/em/winter12/highlight2.html#title. ↩
-
Plyer, A. and Gardere, L. (2018), The New Orleans Prosperity Index: Tricentennial Edition. Retrieved October 17, 2021 from https://s3.amazonaws.com/gnocdc/reports/ProsperityIndex.pdf. ↩
-
The latest Supplemental Poverty Measure report can be found at https://www.census.gov/library/publications/2025/demo/p60-287.html. ↩ ↩
-
Guidance for how to approximate the Supplemental Poverty Measure using ACS geographies can be found at https://www.census.gov/content/dam/Census/library/working-papers/2020/demo/SEHSD-WP2020-09.pdf. ↩ ↩
-
Difference between Black and Hispanic not statistically significant at a 95% confidence level. ↩
-
De Jong, G.F., Graefe, D.R., Hall, M., and Singer, A. (2001). The geography of immigrant skills: Educational profiles of metropolitan areas. Retrieved February 8, 2021 from https://www.brookings.edu/research/the-geography-of-immigrant-skills-educational-profiles-of-metropolitan-areas/. ↩
-
Based on surveys conducted by the U.S. Census Bureau, employment-related reasons are the most frequent reason for inter-county moves of greater than 50 miles. For example, among people in the United States who moved over 500 miles, 52 percent moved for an employment-related reason compared to 23 percent for a family-related reason and 22 percent for a housing-related reason. Employment-related reasons include a new job or job transfer, to look for work, to be closer to work, retirement, and other job-related reasons. See U.S. Census Bureau. (n.d.). Geographic Mobility: 2011 to 2012 (Table 27). Retrieved February 8, 2021 from https://www.census.gov/topics/population/migration/data/tables/cps.2012.html. ↩
-
Based on surveys conducted by the U.S. Census Bureau, people 25 to 29 years old were more likely than other age groups to be movers from a different county, state, region, or country. And people with a professional or graduate degree were also more likely than other educational groups to be movers from a different county, state, region, or country. See U.S. Census Bureau. (n.d.). Geographic Mobility: 2011 to 2012 (Table 1). Retrieved September 23, 2013 from https://www.census.gov/topics/population/migration/data/tables/cps.2012.html. ↩
-
State of Louisiana Office of Community Development. (2013). The Homeowner Assistance Program Week 375 Situation & Pipeline Report. ↩